Research Article | | Peer-Reviewed

Seasonal Variations in Equatorial Ionospheric Response to Geomagnetic Storms Using GNSS ROTI Observations

Received: 26 May 2025     Accepted: 12 June 2025     Published: 9 September 2025
Views:       Downloads:
Abstract

This study investigates the equatorial ionospheric response to geomagnetic storms using the rate of change of total electron content (TEC) index (ROTI) derived from Global Navigation Satellite Systems (GNSS) data as a measure of ionospheric irregularities. TEC data were collected from GNSS stations across Nigeria, with days classified as quiet (|Dst| < 30 nT) or disturbed (|Dst| ≥ 50 nT), analyzed separately for daytime and nighttime periods. The response to the geomagnetic storm on February 19, 2014, was examined, along with three sudden storm commencements (SSCs) on February 15, 20, and 23, and a high-speed solar wind event on February 19. Findings indicate that geomagnetic storms did not inhibit irregularities but partially suppressed them during the storm’s initial and recovery phases, with irregularities peaking during the main phase. Higher ROTI values were recorded during the March equinox compared to the September equinox, under both quiet and disturbed conditions. Irregularities were generally suppressed on disturbed days during the September equinox but were more prevalent during the March equinox. The December solstice exhibited an overall inhibition of irregularities, contrasting with equinox patterns. Morning ROTI values remained below 0.35 TECU/min, while daytime values ranged from 0.35 to 0.8 TECU/min, indicating moderate irregularities. This study provides insights crucial for improving GNSS reliability in equatorial regions. Continuous monitoring, expanded GNSS networks, and predictive models are recommended to mitigate storm-induced disruptions to communication and navigation systems.

Published in American Journal of Aerospace Engineering (Volume 11, Issue 1)
DOI 10.11648/j.ajae.20251101.12
Page(s) 14-22
Creative Commons

This is an Open Access article, distributed under the terms of the Creative Commons Attribution 4.0 International License (http://creativecommons.org/licenses/by/4.0/), which permits unrestricted use, distribution and reproduction in any medium or format, provided the original work is properly cited.

Copyright

Copyright © The Author(s), 2025. Published by Science Publishing Group

Keywords

Geomagnetic Storm, Equatorial Ionosphere, Ionospheric Irregularities, TEC, ROTI, Fluctuation Indices

1. Introduction
The geomagnetic storm is a severe global disturbance of the Earth’s magnetic field, usually under the impact of disturbances in the solar wind and Interplanetary Magnetic Field (IMF) with their origins near the solar surface. These storms significantly influence the Earth's ionosphere, particularly in equatorial regions, by altering electron density and affecting communication and navigation systems.
Geomagnetic storms induce harmful disturbances in the geospace environment and can significantly alter the ionosphere, negatively affecting both space- and ground-based systems . One key ionospheric parameter affected by geomagnetic storms is the Total Electron Content (TEC), which represents the number of electrons in a 1 m² cross-sectional area column between a GNSS satellite and the receiver . Variations in TEC can cause range errors for navigation signals, with 1 TECU resulting in approximately a 0.163 m range error at the GNSS L1 frequency (1.5754 GHz) . Sharp and rapid variations in TEC are crucial for the occurrence of ionospheric plasma-density irregularities . These irregularities can cause scintillations of radio waves , and severe scintillations can lead to loss of signal and cycle slips in trans-ionospheric radio systems .
During geomagnetic storms, the equatorial ionosphere is influenced by electric field which can disturb the ambient equatorial electric field. During the main phase of a storm, when the interplanetary magnetic field (IMF Bz) is south, prompt penetration of electric field (PPEF) may occur and therefore may affect the vertical drift of plasma over the equatorial region. The field assumes eastward (or westward) configuration during the evening (or post-evening) period, hence, can strengthen (or weaken) the vertical drift of plasma, thereby enhancing (or disrupting) the condition favourable for the development of irregularities .
During the recovery phase, the electric field exhibits an opposite configuration, suppressing the PRE drift and consequently inhibiting the development of irregularities. Storm input that produces auroral heating drives disturbance thermospheric circulation and equatorward winds, responsible for the development of disturbance wind dynamo electric field (DDEF) . When DDEF is westward (drifting downward) in the evening hours, the normal PRE can be suppressed or reversed, thereby inhibiting irregularity formation . The ring current, as parametrized by the disturbance storm time (Dst) index, also plays a significant role in establishing conditions necessary for the generation or inhibition of irregularities during storms. , irregularities are generated if the maximum excursion of Dst occurs between midnight to post-midnight and inhibited if it takes place in the early afternoon.
The time variation of total electron content also known as rate of change of TEC (ROT) has been used to measure GPS phase fluctuation activity and to indicate the occurrence of ionospheric irregularities during storms by different authors . A quantitative relationship between TEC fluctuations and amplitude scintillation index, S4, has been established using ROTI, the standard deviation of ROT taken over 5 min .
Some studies pointed out that intense and very intense magnetic storms occur when the magnitudes of the solar wind velocity and the IMF-Bz intensity are substantially greater than their nominal values, 400km/s and 5nT respectively . also concluded that the sharp increase in the solar wind dynamic pressure, associated with an increase in solar wind bulk velocity and ion density do compress the magnetosphere to form magnetic storms.
Furthermore, GPS observation networks of the IGS service have been utilized in several studies to monitor TEC fluctuations and ionospheric irregularities during geomagnetic storms at various latitudes. used the rate of change of TEC (ROT), representing the time variation of TEC, to measure GPS phase fluctuation activity and indicate the occurrence of ionospheric irregularities during different storms. A quantitative relationship between TEC fluctuations and amplitude scintillation index S4 has been established using ROTI, the standard deviation of ROT taken over a 5-minute interval . However, few research has been carried out over African equatorial region because of the longtime absence of ionospheric observation tool over the African equatorial region. The aim of this study is to investigate the impact of geomagnetic storms on equatorial ionospheric plasma dynamics and distribution, to analyze the physical mechanisms driving the generation and propagation of ionospheric disturbances during these storms, and to examine differences in ionospheric responses between quiet and disturbed geomagnetic conditions. This research seeks to enhance our understanding of equatorial ionospheric variability and its implications for space weather effects on communication and navigation systems.
2. Data and Methods
The global positioning system (GPS) has become an important tool to monitor the behavior of ionospheric irregularities due to the loss of tracking of its signals associated with strong phase fluctuation . Consequently, one year GPS data for the year 2014 (a year of high solar activity for the solar cycle 24), comprising of both the quiet and disturbed periods is investigated using the fluctuation indices derived from the GPS measurements.
The GPS data are the simultaneous measurements from the receivers located within Nigerian ionosphere. The GNSS observation data in Receiver Independent Exchange (RINEX) format were obtained from the Nigerian GNSS Reference Network (NIGNET) server (http://www.nignet.net/data/). Observation data, satellite navigation data and the Differential Code Bias (CDB) files were used for this study. Figure 1 shows the geographical distribution of the GNSS receivers utilized in this research across Nigeria. The location, station’s name, country, code, geodetic and geomagnetic information are indicated in Table 1.
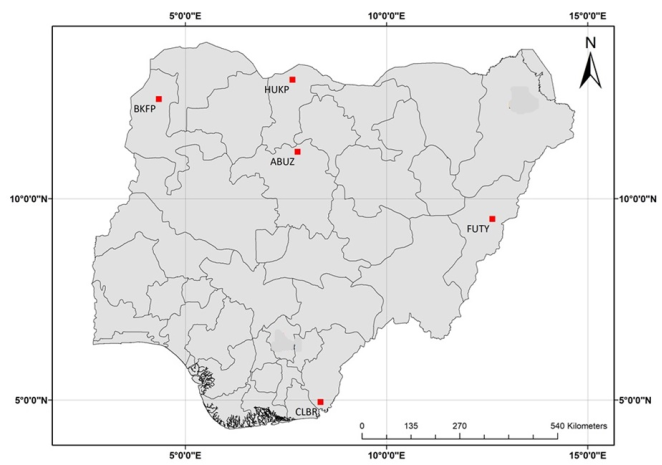
Figure 1. Locations of the GNSS receivers used in this study.
Table 1. The list of Stations used together with their geophysical detail.

Station code

Station location

Geographic Lat. (deg.) Long. (deg.)

Geomagnetic Lat. (deg.) Long. (deg.)

ABUZ

Zaria

11.17

7.79

- 0.62

79.88

BKFP

Birnin Kebbi

12.48

4.34

+ 0.72

76.72

CLBR

Calabar

4.95

8.36

- 4.30

80.09

FUTY

Yola

9.50

12.63

- 1.17

84.44

HUKP

Katsina

12.96

7.66

+ 1.08

79.84

Different observation techniques have been used to study the irregularities in the ionosphere. The GPS-TEC analysis software developed by Gopi Seemala of the Indian Institute of Geomagnetism was used in this study to estimate the value of TEC from the GPS RINEX files. To eliminate any multipath effects an elevation cut-off mask of 45° was used. Different geomagnetic day conditions were considered using Disturbance storm time (Dst) index. The Dst index data were obtained from NASA’s OMNIweb Service (https://omniweb.gsfc.nasa.gov). The monthly average value of TEC for each hour is calculated from the diurnal values of TEC for all the days in a month. Further, the means of the daily ROTI profiles for all the quiet (or disturbed) days in the month were computed.
The months in the year were further grouped into four, namely: (i) February, March, and April to represent the March equinox (MEQU), (ii) May, June, and July as June solstice (JSOL), (iii) August, September, and October as September equinox (SEQU) and (iv) November, December, and January as December solstice (DSOL) for the seasonal study.
The quiet days are days in which the absolute values of the |Dst| indices are consistently less than 30 nT (|Dst| < 30 nT) for all hours in the day, while disturbed days are days in which one or more hours in the day have absolute |Dst| indices greater than or equal to 50 nT (|Dst| ≥ 50 nT) for the year 2014 for both the daytime and nighttime period.
Different fluctuation indices have been adopted by different researchers to study ionospheric irregularities. For example, employed FP index, used power spectral index (n) while used rate of TEC index (ROTI) as a measure of the fluctuation level. In this study, the Rate of change of TEC index (ROTI) was employed.
ROTI is a parameter derived from time variation of TEC (i.e., rate of change of TEC (ROT) given by equation 1).
ROT=dTECdt (1)
The computation of ROT was performed using equation 2.
ROTt=STECt+ t-STEC(t)t×cosθt (2)
In this equation, 't' represents the instantaneous time, while ∆t denotes the sampling interval, which was set at 30 seconds in our study. The inclusion of the term cosθ(t) in the formula aimed to compensate for the variations in signal path length caused by the changing zenith angle. When radio signals travel from satellites at lower elevations (resulting in higher zenith angles), they traverse a more extensive portion of the ionosphere. By incorporating the cos θ(t) term, we were able to eliminate the influence of these longer signal path changes in the ionosphere.
ROTI is the standard deviation of ROT over a 5-minute period, and it is given by the expression in equation 3 [21].
ROTI= <ROT2>-<ROT>2 (3)
The term “ROT²” is the square of the rate of Total Electron Content at a given time, the bracket “< >” represents the average values over a certain period. And the term “<ROT>²” represents the square of the average values of ROT over the same period.
Using the expression in equation 3 the average ROTI (ROTIave) (ROTIave is a good proxy that indicates the 30-minutes phase fluctuation level over a location.) as the average of ROTI over 30 min interval for a satellite and then the average over all satellites in view was computed. This result gives the average level of irregularities (phase fluctuation) for half an hour over the station.
ROTIave0.5h= 1nsat(0.5h) nnsat.ikROTI(n, 0.5h, i)k (4)
where n is the satellite number, h is hour (0, 0.5, 1…23.5, 24 UT), i is the 5 min section within half an hour (i = 1, 2, 3, 4, 5, and 6), nSat (0.5 h) is the number of satellites observed within half an hour, and k is the number of ROTI values available within half an hour for a particular satellite.
To detect the presence of irregularities, the classification by where ROTIave< 0.4 TECU/min indicates the background irregularities (i.e., absent of irregularities), 0.4 < ROTIave < 0.8 indicates the presence of moderate irregularities, and ROTIave > 0.8 indicates the occurrence of severe irregularities was adopted in this study. Results of this study will be presented in the chapter four (4) of this thesis.
3. Results and Discussions
Studies have shown that the February 2014 storm was triggered by four Earth-directed coronal mass ejections (CMEs), leading to a highly complex, multiphase geomagnetic storm. The first CME arrived on 15 February, followed by three more on 19, 20, and 23 February . Specifically, the geomagnetic storm on 19 February 2014 was caused by two powerful Earth-directed CMEs, resulting in a minimum Dst of -119 nT .
The depression of Dst began at 00:00 UT on 19 February with a Dst value of -61 nT and an accelerated interplanetary electric field (IEF) Ey of 3.26 mV/m. The interplanetary magnetic field (IMF) Bz was directed southward at -7.6 nT, with a solar wind plasma speed of 393 km/s. This progression is characteristic of a geomagnetic storm, as noted by .
Figure 2 presents the space weather indices during the storm period. The Kp index reached a value of 43 (> 4), and the F10.7 index was 154 sfu. Auroral activity showed values of 403 nT for AE and -346 nT for AL, suggesting that intense auroral activity could have generated disturbance dynamo electric fields and winds, impacting equatorial latitudes during the 19 February storm. As the solar wind plasma speed collided with Earth’s magnetic field, changes in Dst indicated the onset of the geomagnetic storm. The maximum Dst disturbance of -101 nT was recorded at 07:00 UT, with the IMF Bz drifting southward to -13.5 nT and a solar wind plasma speed of 466 km/s, which persisted until 08:00 UT (Dst -119 nT). At this stage, the Kp index was 63 (> 4), and the solar wind plasma speed was 454 km/s, with the IMF Bz at -10 nT. This marked the gradual recovery of the storm, with the Dst index improving to -98 nT by 09:00 UT. At this point, the IMF Bz was -3.7 nT, and the plasma wind speed was 453 km/s.
The full recovery of the storm began at 17:00 UT (33.5% of the Dst value) with an IMF Bz of -2.7 nT and a solar wind speed of 475 km/s. The storm exhibited a sudden commencement with multiple main and recovery phases, consistent with findings reported by .
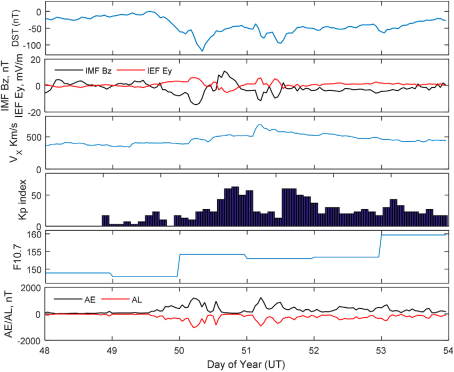
Figure 2. Space weather indices during the geomagnetic storm of 19 February 2014. From top to bottom, Dst, IMF Bz, IEF Ey, solar wind speed, Kp index, solar flux F10.7 cm, and Aurora indices (AE/AL).
3.1. Generation and Inhibition of Irregularities During Geomagnetic Storm
Study of storm time disturbance dynamo electric field effects at equator by have indicated that disturbance dynamo electric fields will be eastward during nighttime, while they are westward during daytime. In fact, showed that disturbance dynamo impacted first during the storm and later the prompt penetration of high-latitude electric fields when the disturbance dynamo effect was alive in the dusk sector.
It is known that significant compositional and electrodynamical changes occur in the equatorial and low-latitude ionosphere during disturbed periods due to changes in the thermosphere-ionosphere brought in by the disturbed thermospheric neutral winds and high-latitude Joule heating . The prompt penetration electric field (PPEFs) occurs in the low-latitude region during the sudden southward (undershielding electric field) or northward (overshielding electric field) turning of the interplanetary magnetic field (IMF Bz) .
Figure 3 displays diurnal plots illustrating the Rate of Total Electron Content Index (ROTI) across five stations over Nigeria for all the days in the month of February, 2014. The figure shows that during the main phase, the storm appeared not to have hindered the development of irregularities across all the stations but partly inhibited before and after the main phase of the storm. The observation of irregularities during the main phase of the storm can be partly attributed to the storm timing. The storm main phase occurred between the local mid-night hours and the post-sunset period. According to , irregularities are generated if the maximum excursion of Dst occurs between midnight to post-midnight and inhibited if it takes place in the early afternoon.
The penetration of electric fields around this period may not have hindered the occurrence but may rather favor it. It is well known that the Rayleigh-Taylor (R-T) and plasma density instabilities that cause the development of irregularities in the ionosphere are affected by some external driving forces such as electric fields, the magnetic field and neutral wind . Due to the uniqueness of the magnetic orientation at the equatorial region, the ionosphere at the equatorial region is sensitive to any change in electric field. During geomagnetic storms, strong electric fields which originate from the magnetosphere can penetrate down to low latitudes . An eastward (or westward) electric field during the daytime may favor (or impedes) the upward drift of plasma. The injection of the eastward electric field during the main phase may have intensified the normal upward plasma drift and may have favored the development of irregularities.
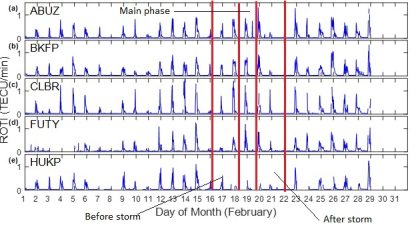
Figure 3. 19 February 2014 storm over ABUZ, BKFP, CLBR, FUTY and HUKP respectively.
3.2. Time Rate of Change in TEC and Storm Impact Analysis
Figure 4 below depicts the time rate of change in TEC calculated over 5-minute intervals. The Dst index was used to assess the impact of storm intensity on scintillation enhancement or inhibition. The results indicate that storm events did not inhibit the occurrence of irregularities across all stations. Observations from the ROTI index reveal ROTI < 0.35 TECU/min, indicating no fluctuations in the early morning hours, and 0.35 ≤ ROTI < 0.8 TECU/min, indicating moderate ionospheric irregularities predominantly in the daytime sector.
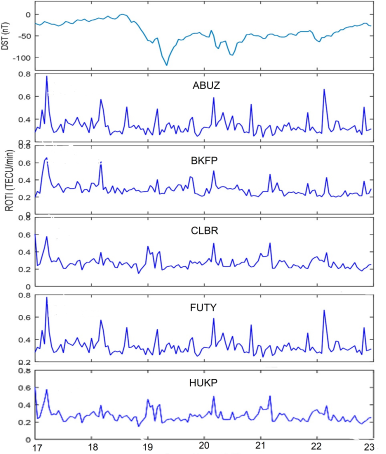
Figure 4. The rate of change in TEC index (ROTI) TECU/min for 19 February 2014 initial and recovery phases of the geomagnetic storm.
The density of occurrence gradually diminishes as electrons propagate along magnetic field lines, following latitudinal gradients. This suggests that the disturbance travels northward during the prestorm morning sector around 04:00 UT, aligning with the findings of and who identified atmospheric gravity waves as major drivers of daytime medium-scale traveling ionospheric disturbances. The increased occurrence at stations such as CLBR and BKFP may be attributed to variations in geomagnetic latitudes. observed that stations farther from the geomagnetic equator and closer to the southern anomaly crest experience more fluctuations than those nearer to the geomagnetic equator.
3.3. Monthly Variation of ROTI Under Quiet and Disturbed Geomagnetic Conditions
The monthly variation of Rate of Total Electron Content Index (ROTI) is a critical aspect of ionospheric studies, offering insights into the dynamic behavior of the ionosphere under different conditions. Understanding how ROTI fluctuates over time, particularly during both quiet and disturbed periods, is essential for assessing ionospheric irregularities and their potential impact on communication and navigation systems. In this section, the monthly trends of ROTI were studied, examining variations observed during periods of both quiet and disturbed ionospheric conditions.
Figure 5 shows the monthly variation of ROTI during the quiet and disturbed days for March, September, and December respectively, during the year 2014. There was no sufficient data availability during the June solstice and across some stations for this analysis. The vertical axis shows the ROTI values while the horizontal axis shows the LST (Hr). High values of ROTI were recorded during the March equinox than September equinox for both quiet and disturbed geomagnetic conditions. During the September equinox, irregularity occurrence was largely inhibited during disturbed days, while an opposite pattern was observed during the March equinox across all stations. The inhibition of the irregularities during the September equinox may be attributed to storm-induced disturbance dynamo mechanism, which may inhibit the occurrence of ionospheric irregularities in the region due to the action of disturbance electric fields . Further, the occurrence of irregularity was largely inhibited during the December solstice for both the quiet and disturbed geomagnetic conditions. This is opposite to the observations during the equinoxes.
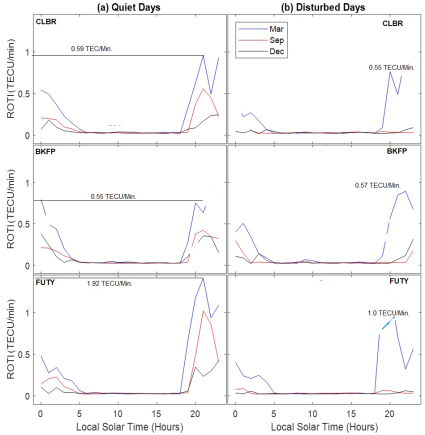
Figure 5. Monthly variation of ROTI during quiet and disturbed days (panel (a) quiet days and (b) for disturbed days) for ABUZ, BKFP, and CLBR, during March, September, and December 2014.
4. Conclusion
This study has examined the equatorial ionospheric response to geomagnetic storms using ground-based GNSS observations, with ROTI serving as the primary metric for assessing ionospheric irregularities. The investigation identified key geomagnetic disturbances, including sudden storm commencements (SSCs) on February 15, 20, and 23, and a high-speed solar wind (HSSW) event on February 19, 2014. The findings reveal that geomagnetic storms did not inhibit the development of ionospheric irregularities across the study locations. Although irregularities were partially suppressed during the storm's commencement and recovery phases, they were prevalent during the storm's main phase.
Seasonal variations played a significant role in the occurrence and intensity of ionospheric irregularities. The March equinox recorded higher ROTI values compared to the September equinox, under both quiet and disturbed geomagnetic conditions. Interestingly, irregularities were largely suppressed during disturbed days in the September equinox, whereas an opposite pattern was observed in the March equinox. The December solstice, on the other hand, showed a marked inhibition of irregularities under both quiet and disturbed conditions, which contrasted with the equinox patterns. Early morning observations typically showed ROTI values below 0.35 TECU/min, indicating minimal fluctuations, while daytime ROTI values ranged from 0.35 to 0.8 TECU/min, indicating moderate irregularities.
These results underscore the complex relationship between geomagnetic storms, seasonal variations, and ionospheric irregularities, particularly in the equatorial region. The study enhances our understanding of how geomagnetic disturbances influence ionospheric behaviour, providing crucial insights for improving the reliability of communication and navigation systems affected by ionospheric fluctuations.
To improve understanding, this study recommends expanding datasets for robust analysis, developing predictive models to anticipate disturbances, and implementing seasonal mitigation strategies during high-risk periods, such as the March equinox, to protect communication systems.
Conflicts of Interest
The authors declare no conflicts of interest.
References
[1] E. Ghamry, A. Lethy, T. Arafa-Hamed, and E. Abd Elaal, “A comprehensive analysis of the geomagnetic storms occurred during 18 February and 2 March 2014,” NRIAG Journal of Astronomy and Geophysics, vol. 5, no. 1, pp. 263-268, Jun. 2016,
[2] A. O. Akala, P. H. Doherty, C. E. Valladares, C. S. Carrano, and R. Sheehan, “Statistics of GPS scintillations over South America at three levels of solar activity,” Radio Sci, vol. 46, no. 5, Oct. 2011,
[3] O. S. Bolaji, J. O. Adeniyi, I. A. Adimula, S. M. Radicella, and P. H. Doherty, “Total electron content and magnetic field intensity over Ilorin, Nigeria,” J Atmos Sol Terr Phys, vol. 98, pp. 1-11, Jun. 2013,
[4] C. E. Valladares and J. L. Chau, “The Low-Latitude Ionosphere Sensor Network: Initial results,” Radio Sci, vol. 47, no. 4, Aug. 2012,
[5] P. M. Kintner, B. M. Ledvina, and E. R. de Paula, “GPS and ionospheric scintillations,” Space Weather, vol. 5, no. 9, Sep. 2007,
[6] I. S. Batista and M. A. Abdu, “Ionospheric variability at Brazilian low and equatorial latitudes: comparison between observations and IRI model,” Advances in Space Research, vol. 34, no. 9, pp. 1894-1900, 2004,
[7] O. S. Bolaji, S. J. Adebiyi, and J. B. Fashae, “Characterization of ionospheric irregularities at different longitudes during quiet and disturbed geomagnetic conditions,” J Atmos Sol Terr Phys, vol. 182, pp. 93-100, Jan. 2019,
[8] M. A. Abdu, I. S. Batista, B. W. Reinisch, J. H. A. Sobral, and A. J. Carrasco, “Equatorial F region evening vertical drift, and peak height, during southern winter months: A comparison of observational data with the IRI descriptions,” Advances in Space Research, vol. 37, no. 5, pp. 1007-1017, Jan. 2006,
[9] J. Aarons, “The role of the ring current in the generation or inhibition of equatorial F layer irregularities during magnetic storms,” Radio Sci, vol. 26, no. 4, pp. 1131-1149, 1991,
[10] O. A. Oladipo and T. Schüler, “Equatorial ionospheric irregularities using GPS TEC derived index,” J Atmos Sol Terr Phys, vol. 92, pp. 78-82, Jan. 2013,
[11] O. Ikani, F. N. Okeke, K. C. Okpala, D. Okoh, and B. Rabiu, “Diurnal and seasonal variations of the occurrence of ionospheric irregularities over Nigeria from GNSS data,” Frontiers in Astronomy and Space Sciences, vol. 10, Jul. 2023,
[12] S. Basu et al., “Response of the equatorial ionosphere in the South Atlantic Region to the Great Magnetic Storm of July 15, 2000,” Geophys Res Lett, vol. 28, no. 18, pp. 3577-3580, Sep. 2001,
[13] A. Calabia and S. Jin, “New Modes and Mechanisms of Long‐Term Ionospheric TEC Variations From Global Ionosphere Maps,” J Geophys Res Space Phys, vol. 125, no. 6, Jun. 2020,
[14] Y. Jin et al., “Ionospheric Plasma Irregularities Based on In Situ Measurements From the Swarm Satellites,” J Geophys Res Space Phys, vol. 125, no. 7, Jul. 2020,
[15] M. A. Abdu, R. T. de Medeiros, J. A. Bittencourt, and I. S. Batista, “Vertical ionization drift velocities and range type spread F in the evening equatorial ionosphere,” J Geophys Res Space Phys, vol. 88, no. A1, pp. 399-402, Jan. 1983,
[16] X., M. A. J., L. U. J., & H. C. M. Pi, Monitoring of global ionospheric irregularities using the world-wide GPS network, vol. 24(18). 1997.
[17] M. Nishioka, A. Saito, and T. Tsugawa, “Occurrence characteristics of plasma bubble derived from global ground-based GPS receiver networks,” J Geophys Res Space Phys, vol. 113, no. 5, May 2008,
[18] C. Lee, J. Liu, B. W. Reinisch, Y. Lee, and L. Liu, “The propagation of traveling atmospheric disturbances observed during the April 6-7, 2000 ionospheric storm,” Geophys Res Lett, vol. 29, no. 5, Mar. 2002,
[19] M. Mendillo, B. Lin, and J. Aarons, “The application of GPS observations to equatorial aeronomy,” Radio Sci, vol. 35, no. 3, pp. 885-904, May 2000,
[20] G. Li, B. Ning, L. Liu, Z. Ren, J. Lei, and S.-Y. Su, “The correlation of longitudinal/seasonal variations of evening equatorial pre-reversal drift and of plasma bubbles,” Ann Geophys, vol. 25, no. 12, pp. 2571-2578, Jan. 2007,
[21] X. Pi, A. J. Mannucci, U. J. Lindqwister, and C. M. Ho, “Monitoring of global ionospheric irregularities using the Worldwide GPS Network,” Geophys Res Lett, vol. 24, no. 18, pp. 2283-2286, Sep. 1997,
[22] M., L. B., & A. J. Mendillo, “The application of GPS observations to equatorial aeronomy,” Radio Sci, vol. 35(3), pp. 885-904, May 2000.
[23] B. T. Tsurutani et al., “Corotating solar wind streams and recurrent geomagnetic activity: A review,” J Geophys Res Space Phys, vol. 111, no. A7, Jul. 2006,
[24] B. G. Fejer, “Low latitude storm time ionospheric electrodynamics,” J Atmos Sol Terr Phys, vol. 64, no. 12-14, pp. 1401-1408, Aug. 2002,
[25] G. Li et al., “On the occurrence of postmidnight equatorial F region irregularities during the June solstice,” J Geophys Res Space Phys, vol. 116, no. A4, p. n/a-n/a, Apr. 2011,
[26] C. M. Anoruo, B. Rabiu, D. Okoh, F. N. Okeke, and K. C. Okpala, “Irregularities in the African ionosphere associated with total electron content anomalies observed during high solar activity levels,” Frontiers in Astronomy and Space Sciences, vol. 9, Sep. 2022,
Cite This Article
  • APA Style

    Ikani, O., Yakubu, T. I., Najib, Y., Obiegbuna, D. C. (2025). Seasonal Variations in Equatorial Ionospheric Response to Geomagnetic Storms Using GNSS ROTI Observations. American Journal of Aerospace Engineering, 11(1), 14-22. https://doi.org/10.11648/j.ajae.20251101.12

    Copy | Download

    ACS Style

    Ikani, O.; Yakubu, T. I.; Najib, Y.; Obiegbuna, D. C. Seasonal Variations in Equatorial Ionospheric Response to Geomagnetic Storms Using GNSS ROTI Observations. Am. J. Aerosp. Eng. 2025, 11(1), 14-22. doi: 10.11648/j.ajae.20251101.12

    Copy | Download

    AMA Style

    Ikani O, Yakubu TI, Najib Y, Obiegbuna DC. Seasonal Variations in Equatorial Ionospheric Response to Geomagnetic Storms Using GNSS ROTI Observations. Am J Aerosp Eng. 2025;11(1):14-22. doi: 10.11648/j.ajae.20251101.12

    Copy | Download

  • @article{10.11648/j.ajae.20251101.12,
      author = {Ojochenemi Ikani and Tudunwada Ibrahim Yakubu and Yusuf Najib and Dominic Chukwuebuka Obiegbuna},
      title = {Seasonal Variations in Equatorial Ionospheric Response to Geomagnetic Storms Using GNSS ROTI Observations
    },
      journal = {American Journal of Aerospace Engineering},
      volume = {11},
      number = {1},
      pages = {14-22},
      doi = {10.11648/j.ajae.20251101.12},
      url = {https://doi.org/10.11648/j.ajae.20251101.12},
      eprint = {https://article.sciencepublishinggroup.com/pdf/10.11648.j.ajae.20251101.12},
      abstract = {This study investigates the equatorial ionospheric response to geomagnetic storms using the rate of change of total electron content (TEC) index (ROTI) derived from Global Navigation Satellite Systems (GNSS) data as a measure of ionospheric irregularities. TEC data were collected from GNSS stations across Nigeria, with days classified as quiet (|Dst| < 30 nT) or disturbed (|Dst| ≥ 50 nT), analyzed separately for daytime and nighttime periods. The response to the geomagnetic storm on February 19, 2014, was examined, along with three sudden storm commencements (SSCs) on February 15, 20, and 23, and a high-speed solar wind event on February 19. Findings indicate that geomagnetic storms did not inhibit irregularities but partially suppressed them during the storm’s initial and recovery phases, with irregularities peaking during the main phase. Higher ROTI values were recorded during the March equinox compared to the September equinox, under both quiet and disturbed conditions. Irregularities were generally suppressed on disturbed days during the September equinox but were more prevalent during the March equinox. The December solstice exhibited an overall inhibition of irregularities, contrasting with equinox patterns. Morning ROTI values remained below 0.35 TECU/min, while daytime values ranged from 0.35 to 0.8 TECU/min, indicating moderate irregularities. This study provides insights crucial for improving GNSS reliability in equatorial regions. Continuous monitoring, expanded GNSS networks, and predictive models are recommended to mitigate storm-induced disruptions to communication and navigation systems.
    },
     year = {2025}
    }
    

    Copy | Download

  • TY  - JOUR
    T1  - Seasonal Variations in Equatorial Ionospheric Response to Geomagnetic Storms Using GNSS ROTI Observations
    
    AU  - Ojochenemi Ikani
    AU  - Tudunwada Ibrahim Yakubu
    AU  - Yusuf Najib
    AU  - Dominic Chukwuebuka Obiegbuna
    Y1  - 2025/09/09
    PY  - 2025
    N1  - https://doi.org/10.11648/j.ajae.20251101.12
    DO  - 10.11648/j.ajae.20251101.12
    T2  - American Journal of Aerospace Engineering
    JF  - American Journal of Aerospace Engineering
    JO  - American Journal of Aerospace Engineering
    SP  - 14
    EP  - 22
    PB  - Science Publishing Group
    SN  - 2376-4821
    UR  - https://doi.org/10.11648/j.ajae.20251101.12
    AB  - This study investigates the equatorial ionospheric response to geomagnetic storms using the rate of change of total electron content (TEC) index (ROTI) derived from Global Navigation Satellite Systems (GNSS) data as a measure of ionospheric irregularities. TEC data were collected from GNSS stations across Nigeria, with days classified as quiet (|Dst| < 30 nT) or disturbed (|Dst| ≥ 50 nT), analyzed separately for daytime and nighttime periods. The response to the geomagnetic storm on February 19, 2014, was examined, along with three sudden storm commencements (SSCs) on February 15, 20, and 23, and a high-speed solar wind event on February 19. Findings indicate that geomagnetic storms did not inhibit irregularities but partially suppressed them during the storm’s initial and recovery phases, with irregularities peaking during the main phase. Higher ROTI values were recorded during the March equinox compared to the September equinox, under both quiet and disturbed conditions. Irregularities were generally suppressed on disturbed days during the September equinox but were more prevalent during the March equinox. The December solstice exhibited an overall inhibition of irregularities, contrasting with equinox patterns. Morning ROTI values remained below 0.35 TECU/min, while daytime values ranged from 0.35 to 0.8 TECU/min, indicating moderate irregularities. This study provides insights crucial for improving GNSS reliability in equatorial regions. Continuous monitoring, expanded GNSS networks, and predictive models are recommended to mitigate storm-induced disruptions to communication and navigation systems.
    
    VL  - 11
    IS  - 1
    ER  - 

    Copy | Download

Author Information
  • Centre for Atmospheric Research, National Space Research and Development Agency, Kogi State University Campus, Anyigba, Nigeria

  • Centre for Atmospheric Research, National Space Research and Development Agency, Kogi State University Campus, Anyigba, Nigeria

  • Centre for Atmospheric Research, National Space Research and Development Agency, Kogi State University Campus, Anyigba, Nigeria

  • Department of Physics and Astronomy, University of Nigeria, Nsukka, Nigeria