Research Article | | Peer-Reviewed

Modelling and Optimization of Ceramic Water Filter Using Experimental Design

Received: 12 May 2025     Accepted: 28 May 2025     Published: 23 June 2025
Views:       Downloads:
Abstract

This study aimed to model and optimize the design of a ceramic water filter using an experimental design approach. The ceramic filter was fabricated from raw clay sourced from the Sè region, while rice husk and sawdust, served as the pore-forming material. The optimization process began with a screening of 11 factors using a screening design, followed by optimization through response surface methodology. The optimizations were performed using Minitab 17.1 software. The responses considered were water flow rate, turbidity, permanganate index, and absorbance at 254 nm. The results showed that filtration rates ranged from 0.01 mL/s to 3.44 mL/s, turbidity removal varied between 78% and 95%, permanganate index removal ranged from 75% to 96%, and E. coli removal was between 50% and 100%. The following conclusions were drawn from the experiment: (1) high flow rate values were achieved at higher hydraulic heads; (2) higher turbidity values occurred when the proportion of pore-forming material was low; (3) the proportion of pore-forming material and the applied hydraulic head jointly influenced the plasticity index; (4) proportions of pore-forming material between 20% and 25% tended to provide the highest reduction in the permanganate index; (5) E. coli removal was higher at lower proportions of pore-forming material, but the hydraulic head tended to reduce this removal. These findings offer new insights into the use of experimental design methodologies for the fabrication of ceramic water filters.

Published in American Journal of Applied Chemistry (Volume 13, Issue 3)
DOI 10.11648/j.ajac.20251303.11
Page(s) 47-62
Creative Commons

This is an Open Access article, distributed under the terms of the Creative Commons Attribution 4.0 International License (http://creativecommons.org/licenses/by/4.0/), which permits unrestricted use, distribution and reproduction in any medium or format, provided the original work is properly cited.

Copyright

Copyright © The Author(s), 2025. Published by Science Publishing Group

Keywords

Ceramic Water Filter, Household Water Treatment, Experimental Design Methodology

1. Introduction
Access to clean and safe drinking water is fundamental to public health, yet it remains an elusive goal for millions around the globe, particularly in developing countries . The World Health Organization (WHO) estimates that over 2 billion people lack access to safe drinking water, leading to an alarming rate of waterborne diseases that claim approximately 2.2 million lives annually . This crisis is exacerbated by inadequate water treatment infrastructure, increasing urbanization, and the effects of climate change, which together contribute to the contamination of water supplies. In this context, innovative and sustainable water purification solutions are urgently needed to safeguard human health and ensure access to safe drinking water .
Ceramic water filters have emerged as a viable solution to address these challenges. These filters utilize porous ceramic materials to physically remove impurities and pathogens from water, providing an effective barrier against harmful microorganisms . Their simplicity in design, low manufacturing costs, and ability to operate without the need for complex machinery make them particularly well-suited for rural and low-income communities . Additionally, ceramic filters can be produced locally using readily available materials, thereby promoting sustainability and economic development in underserved regions .
Despite the promise of ceramic water filters, their performance can be significantly influenced by various factors, including the composition of the ceramic material, the method of fabrication, pore size distribution, and operational conditions . Research indicates that the effectiveness of these filters is not solely dependent on the materials used but also on the intricate interactions between these factors . For instance, the addition of pore-forming materials such as rice husk can enhance the porosity of the filter, but optimal ratios must be identified to balance strength and filtration efficiency.
Traditionally, process engineers aim to identify the key levels of design parameters that enable responses to reach their optimal values, whether maximizing or minimizing a given function. In optimizing system, the conventional one-factor-at-a-time (OFAT) approach is frequently employed to examine the influence of individual parameters sequentially. While this method is widely recognized, its results may lack significance and predictive reliability when operating conditions change. Given that multiple independent variables and their interactions influence the desired responses, implementing a design of experiments (DOE) strategy combined with statistical and response surface analyses can be highly effective . Unlike the OFAT approach, DOE relies on a structured set of experimental points distributed uniformly across the study domain, enabling the determination of optimal process conditions and the identification of parameter interactions . To this end, experimental design methodologies such as Plackett-Burman Design or Response Surface Methodology (RSM) and factorial designs offer robust frameworks for systematically investigating the effects of multiple variables on filter performance. By employing these statistical tools, researchers can uncover the complex relationships between design parameters, leading to optimized configurations that maximize filtration efficiency while minimizing costs and material usage.
This study aims to model and optimize the design of a ceramic water filter using raw clay as the primary material and rice husk as the pore-forming agent. Through a comprehensive analysis of the factors affecting filtration performance—such as hydraulic head, pore size, and material composition—this research seeks to develop a more effective ceramic water filtration system. It is important to note that, according to the literature, no study has applied the design of experiments (DoE) methodology to optimize the fabrication of ceramic filters intended for point-of-use drinking water production. This aspect underscores the originality of the present work. Ultimately, the findings from this study are anticipated to contribute to the broader goal of enhancing access to safe drinking water in disadvantaged communities, providing a sustainable and practical solution to one of the most pressing challenges of our time.
2. Materials and Methods
2.1. Materials
2.1.1. Clay Materials
The clay materials used in this study were taken from the "Sè" district, which is part of the Houéyogbé municipality in the Mono department. The clay from "Sè" is primarily extracted by local populations for the production of various pottery items. This activity is predominantly carried out by women in the district, who possess centuries of experience in this field. The clay material also finds applications in the construction of dwellings, such as in bricks and roof or wall coverings. The clay extraction site is located at 06°29'35.64" N and 01°47'37.38" E. Additional information regarding the clay material is provided in a prior study that focused on his characterization .
2.1.2. Poor Forming Materials
The pore-forming materials, rice husk and sawdust, were used to create porosity in the filters. They were washed, dried, and then ground. Following this, the materials were sieved and separated into various particle size ranges: D < 45 µm, 45 µm < D < 200 µm, 200 µm < D < 500 µm, 500 µm < D < 800 µm, and 800 µm < D < 1000 µm.
2.1.3. Molding and Forming
A mold with an inner diameter of 73 mm and a variable depth (maximum depth of 80 mm) was fabricated to facilitate the shaping of the filters. After drying and sintering, all the filters were adjusted to a diameter of 50 mm for testing.
2.1.4. Raw Water
Surface water from the Ouémé Valley, which is used by the surrounding populations for domestic purposes and consumption, was used for the various tests. The water was collected at Sissekpa in the locality of Azowlissé. The GPS coordinates of the sampling point are 6°40’51.2’’N and 2°29’59.4’’E.
The characteristics of the water sample used are presented in Table 1. The results indicate relatively high turbidity and the presence of organic matter, which are typical features of surface water.
Table 1. Characteristics of the Raw water treated.

Parameters

Values

Turbidity (NTU)

9.07 ± 0.88

Permanganate Index (mg/L)

8.64

Absorbance UV 254nm

0.083

2.2. Elaboration of Ceramic Filters
The comprehensive protocol established for the fabrication of the ceramic filters involves the following sequential steps:
1) Crushing and Sieving of Clay Materials: The raw clay materials were first crushed to achieve a uniform particle size. This was followed by sieving to remove any larger particles, ensuring a consistent texture essential for effective filtration.
2) Incorporation of Pore-Forming Materials: Rice husk, and sawdust serving as the pore-forming agent, were then added to the prepared clay. The incorporation of these materials enhances the porosity of the final product, improving the filtration capacity of the ceramic filters.
3) Dry Mixing: The clay and rice husk were thoroughly mixed in a dry state to ensure homogeneity. This step is critical to achieve uniform distribution of the pore-forming materials within the clay matrix.
4) Preparation of Ceramic Paste: Water was gradually added to the dry mixture while continuously mixing to form a workable ceramic paste. This paste is crucial for molding and shaping the filters.
5) Curing of the Ceramic Paste: The ceramic paste was allowed to cure for a duration of 24 hours. This curing process is essential for the stabilization of the mixture before it undergoes shaping.
6) Molding of Filters: The cured paste was then pressed into molds to form the desired filter shapes. This pressing technique ensures that the filters attain the necessary density and structural integrity.
7) Drying: Following molding, the filters were dried to remove excess moisture, which is essential to prevent defects during the subsequent firing process.
8) Sintering: Finally, the dried filters were subjected to sintering at high temperatures. This process causes the particles to bond together, enhancing the mechanical strength and durability of the ceramic filters.
2.3. Experimental Setup
The experimental setup consisted of PVC pipes with heights varying from 0.5 m to 2.3 m for the tests performed on the fabricated filters. The filtration column heights were adjusted according to the experimental conditions implemented. The PVC pipes used had a diameter of 63 mm and were interconnected, with water supplied by a pump (Masterflex, Model 77200-60, USA) to maintain a consistent water level (and thus constant pressure) across the different filters. Before use, the filters were tested by immersing them in a container of distilled water to ensure there were no cracks, as air leakage would cause bubble formation. Figure 1 show the filtration columns.
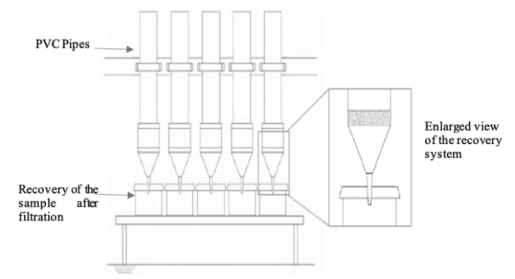
Figure 1. Experimental setup.
The parameters analyzed in this study was turbidity, permanganate oxidation, UV absorbance at 254 nm, and the presence of Escherichia coli (E. coli). The evaluation of physical pollution was conducted by measuring turbidity (NTU) using the NFT 90-033 standard with a Turbiquant 110 IR device from Merck. The assessment of organic matter was determined through the permanganate oxidation method, measured in mg/L, according to the NFT 90-050 standard. This involved gently boiling a water sample in the presence of a known quantity of potassium permanganate and sulfuric acid for 10 minutes, allowing for the reduction of a portion of the permanganate by the oxidizable materials in the sample. Any excess permanganate was then reduced using sodium oxalate in excess, followed by back-titration of the remaining oxalate with permanganate. Additionally, UV absorbance at 254 nm was measured using a Shimadzu UV Mini1240 spectrophotometer, employing quartz cuvettes with a 1 cm optical path length. For microbiological indicators, the presence of Escherichia coli (E. coli) was quantified as colony-forming units per 100 mL using the NFV-08-05 standard and the Rapid-E Coli medium, incubated for 24 hours at 44°C.
2.4. Application of the Experimental Design Methodology
2.4.1. Plackett-burman Design (PBD)
The present study was divided into two parts. In the first part, referred to as experiment T1, a Plackett-Burman Design (PBD) was used to test the simultaneous effect of several factors in the filtration process. The PBD belongs to the broad family of screening experiments, which are particularly important when there are too many factors to be able to test them all in depth. Screening experiments do not seek to develop an exhaustive model, but aim to identify the principal factors, which are generally set at only two levels. So this method was chosen as it is possible to simultaneously test a large number of factors at different levels, understand the importance of each factor compared with the others, and identify which ones to select to optimise the system. We tested eleven factors at two levels (− 1 for the lower level and +1 for the higher level) which consisted of 12 experiments. The response measured were filtration rate, turbidity, permanganate index, and absorbance at 254 nm.
Each factor was varied between two levels: Level -1 (low) and Level +1 (high) (Table 2). The factors analyzed are clay material (A1 and A2), pore-forming material (sawdust and rice husk), granulometry of the pore-forming material (200 < φ < 500 µm and 500 < φ < 800 µm), proportion of pore-forming material (15% and 30%), amount of silver used for disinfection (0 mg/g and 0.03 mg/g), compression ratio during molding (5% and 10%), Temperature ramp during sintering (2 °C/min and 5 °C/min), sintering temperature (850 °C and 1100 °C), sintering time (1 hour and 5 hours), filter thickness (10 mm and 20 mm), and hydraulic head during filtration (0.5 mCE and 2 mCE).
Table 2. Factors tested in the PBD at higher and lower levels (T1).

Variables

Factors

Units

Low (Level -1)

High (Level +1)

U1

Clay Material

-

A1

A2

U2

Pore-Forming Material

-

Sawdust

Rice Husk

U3

Granulometry

µm

200 < φ < 500

500 < φ < 800

U4

Proportion (mass)

%

15

30

U5

Silver (disinfection)

mg/g

0

0.03

U6

Compression ratio

%

5

10

U7

Temperature ramp

°C/min

2

5

U8

Sintering Temperature

°C

850

1100

U9

Sintering Time

h

1

5

U10

Filter Thickness

mm

10

20

U11

Hydraulic Head

mCE

0.5

2

The responses defined for the experiment T1 are: (1) filtration rate, (2) turbidity, (3) permanganate index, and (4) absorbance at 254 nm. The objective is to identify the influential factors and their effects. The proposed mathematical model is a simple polynomial model involving only first-degree terms:
Y=b0+b1X1+b2X2+b3X3+b4X4+b5X5+b6X6+b7X7+b8X8+b9X9+b10X10+b11X11(1)
Statistically significant coefficients are determined by comparing the calculated coefficients to twice the experimental standard deviation (Sd). The interpretation of these coefficients is as follows:
A coefficient is considered statistically insignificant and is excluded from the model if │bi │ < 2Sd;
A coefficient is statistically significant and included in the model if │bi │ > 2Se;
The significant coefficients are sorted in ascending order of their absolute values.
However, only the scientist, familiar with the process being studied can select the factors of interest, as experimental designs primarily serve as decision-making tools. The relative contribution of each factor to the studied phenomenon was calculated using the following equation, also known as the Pareto diagram, which highlights the contribution of each factor to the phenomenon under investigation:
 Pi= bi2bi2*100 i0(2)
Where:
Pi is the contribution of each factor;
bi2 is the square of the coefficient value whose contribution is being evaluated;
∑bi2 is the sum of the squares of the coefficients.
In this study, there were 12 terms to be determined: the constant and the 11 main factors, necessitating at least 12 runs. The classic experimental design adopted is a Plackett-Burman design consisting of 12 runs. The following table presents the Plackett-Burman experimental matrix used.
Table 3. Plackett-Burman experimental matrix.

Runs

X1

X2

X3

X4

X5

X6

X7

X8

X9

X10

X11

1

1

-1

1

-1

-1

-1

1

1

1

-1

1

2

1

1

-1

1

-1

-1

-1

1

1

1

-1

3

-1

1

1

-1

1

-1

-1

-1

1

1

1

4

1

-1

1

1

-1

1

-1

-1

-1

1

1

5

1

1

-1

1

1

-1

1

-1

-1

-1

1

6

1

1

1

-1

1

1

-1

1

-1

-1

-1

7

-1

1

1

1

-1

1

1

-1

1

-1

-1

8

-1

-1

1

1

1

-1

1

1

-1

1

-1

9

-1

-1

-1

1

1

1

-1

1

1

-1

1

10

1

-1

-1

-1

1

1

1

-1

1

1

-1

11

-1

1

-1

-1

-1

1

1

1

-1

1

1

12

-1

-1

-1

-1

-1

-1

-1

-1

-1

-1

-1

2.4.2. Optimization – Central Composite Design (CDD) of Experiments and Response Surface Methodology (RSM)
After selection of two significant factors using PBD, a factorial CCD and RSM were performed to get information about the significant effects and the interactions between the selected factors with positive influence on the following responses: (1) filtration rate, (2) turbidity, (3) permanganate index, (4) E. coli.
The experimental domain used for the optimization is presented in the following table:
Table 4. Central composite Design experimental area.

Variables

Factors

Unité

Center

Variation rate

U1

Pore forming material proportion

%

20

5

U2

Hydraulic head

mCE

1,25

0,75

The following table summarizes the construction principle of the experimental design used:
Table 5. Principle of Composite Design Construction.

Number of factors

Number of factorial runs

Number of star runs

Radius of star points

Number of center runs

2

4

4

1,414

3 ou 5

For this type of plan, there are five (5) levels: -r, -1, 0, +1 and +r. The radius r therefore defines the limits of the experimental domain. Thus, unlike the previously encountered matrices, the levels here are fractional numbers.
A total of 13 experiments were performed, with 5 experiments at the center of the domain.
Table 6. Experimental matrix of the Central Composite Design.

Runs

Design units

X1

X2

1

-1,00000

-1,00000

2

1,00000

-1,00000

3

-1,00000

1,00000

4

1,00000

1,00000

5

-1,414121

0,00000

6

1,41421

0,00000

7

0,00000

-1,41421

8

0,00000

1,41421

9

0,00000

0,00000

10

0,00000

0,00000

11

0,00000

0,00000

12

0,00000

0,00000

13

0,00000

0,00000

The experimental plan is obtained by replacing in the matrix of experiments the coded variables by the real values of the corresponding factors. Each row of the table defines the experimental conditions of an experiment to be performed.
The mathematical model that generally emerges from these matrices is as follows:
Y=a0+aiXi+aijXiXj+bijX2+(3)
With, a0 the average effect, ai the main effects, aij the interaction effects of order 2, bij the so-called quadratic effects and Xi the coded variables.
For model validation, there are two methods. A first method consists in looking at the correlation coefficient between the experimental response and the calculated response. If the correlation coefficient (R) tends towards 1, there is therefore a good correlation between these two answers. The model can therefore be valid. A model can also be considered valid with accuracy if the differences or residuals between the measured responses and those calculated (Yexp. and Ycalc.) do not exceed 0.05 (5%).
Statistical analysis
The statistical analyzes performed include Fisher's test (F test), its associated probability P (F) and the coefficient of determination (R2) which measure the goodness of fit of the regression model. The model's response surface and predicted response contours were used to assess the interaction between significant factors.
Data analysis
The Minitab® 17.1 software was used for the development of the experimental matrices, as well as for the analysis of the experimental data obtained.
3. Results and Discussions
3.1. Screening of Significant Factors Affecting the Efficiency of Ceramic Water Filters Using Plackett-Burman Design
The analysis of the significant factors affecting the efficiency of ceramic water filters using Plackett-Burman Design are presented in table 7.
Analysis of this table showed that the responses varied from 0.02 mL/s to 0.88 mL/s for the flow rate, 53% to 92% for the turbidity, from 0% to 78% for the permanganate index and 18% to 76% for UV254nm absorbance. The high variability in response values shows that one or more factor (s) had an influence on these different responses. The high turbidity removal values lead to the conclusion that the filters allowed a good removal of the particles present in the sample. There was also a good elimination of organic matter. The distribution of these different results is presented on a boxplot (Figure 2).
Table 7. Results from screening with Plackett-Burman Design.

Runs

Flow rate (ml/s)

Turbidity (%)

Permanganate Index (%)

Absorbance 254 nm (%)

1

0.13

71

11

47

2

0.88

78

63

64

3

0.54

72

0

51

4

3.22

86

74

49

5

0.57

92

74

69

6

0.09

62

56

53

7

0.23

86

44

46

8

0.38

87

63

76

9

0.22

81

67

63

10

0.04

81

78

18

11

0.45

53

0

31

12

0.02

53

70

52

The boxplot of the responses are presented on figure 2. It emerges from the analysis of this box plot that experiment 4 of the design corresponded to an atypical value of the measured response (represented by an asterisk on the box plot). In addition, the median (black line in the middle) and the mean (represented by the circled + symbol) were well separated, which means that the range of test results for the "flow rate" response was not homogeneous. An atypical absorbance value (test number 10) was also observed. The other values of this response were evenly distributed within the experimental domain (median combined with the mean). Furthermore, the other responses (turbidity and permanganate index) had homogeneous ranges with no outliers. It was therefore necessary to know whether these variations reflect the manifestation of the effects of the factors during the design of experiments or the natural variability of the responses. Further analysis of the results answered that question.
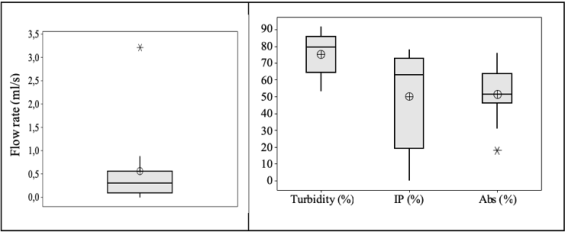
Figure 2. Boxplot of the responses.
3.2. Effects Values
Given that we were in the case of a screening plan of 12 runs and comprising 11 factors, it was a saturated experimental design. Twelve (12) parameters must therefore be estimated, (11 main effects plus the mean) so that the degree of freedom for error should be zero, and an R2 of 100%. All the factors studied had a significant effect on the response. The discussion was then made based on the effects of the factors and the diagrams of the contributions (pareto diagram).
The coefficients "bi" estimated by calculation using the "Minitab 17" software are presented in Table 8. The bar charts are shown in Figure 3. The effect of each factor is considered positive or negative depending on the sign of the coefficient.
Table 8. Estimation of bi coefficients.

Coefficients

Flow rate (ml/s)

Turbidity (%)

Permanganate Index (%)

Absorbance (%)

Constant

b0

0,56

75,17

50,00

51,58

Clay Material

b1

0,26

3,17

9,33

-1,58

Pore-Forming Material

b2

-0,10

-1,33

-10,50

0,75

Granulometry

b3

0,20

2,17

-8,67

2,08

Proportion (mass)

b4

0,35

9,83

14,17

9,58

Silver (disinfection)

b5

-0,26

4,00

6,33

3,42

Compression Ratio

b6

0,15

-0,33

3,17

-8,25

Temperature ramp

b7

-0,26

3,17

-5,00

-3,75

Sintering Temperature

b8

-0,20

-3,17

-6,67

4,08

Sintering Time

b9

-0,22

3,00

-6,17

-3,42

Filter Thickness

b10

0,36

1,00

-3,67

-3,42

Hydraulic Head

b11

0,29

0,67

-12,33

0,08

The analysis of figure 3 showed that for the response reflecting the flow, the diagram highlighted the important factors filter thickness (b10) and proportion of pore-forming material (b4) which had a positive effect on the flow. From a practical perspective, the positive effect of the pore-forming material's proportion is well established, as it is these materials that generate the pores and ultimately create the porous medium. On the other hand, concerning the thickness of the filter, we would expect to have a negative effect, because the thicker the filter, the greater the distance to be traveled and the flow rate should therefore be affected. Apart from these two factors, the hydraulic head (b11) also has a positive effect on the filtration rate.
With regard to turbidity, an important factor immediately standed out: the proportion of pore-forming material (b4) with a positive effect on the response. The particle sizes of the pore-forming materials used for the tests (b3) didn’t influence the results too much.
For the permanganate index, the factors proportion of pore-forming material (b4) and hydraulic head (b11) seemed to be those having the greatest effects. The proportion of pore-forming material had a positive effect while the hydraulic head had a negative effect. A high proportion of pore-forming material increased the number of pores, thereby enhancing the contact surface between the organic matter in the water to be treated and the clay materials, ultimately leading to improved adsorption. Indeed, the studied clay materials have already demonstrated pollutant adsorption capacities based on their characteristics, as evidenced by the values obtained during the determination of cation exchange capacity and specific surface area . Furthermore, the effect of the hydraulic head on the response could be explained by the fact that a high hydraulic head favored a short contact time between the water to be treated and the filter medium. As a result, the adsorption phenomena would be limited.
Regarding absorbance, the proportion of pore-forming material (b4) and the compression ratio (b6) appeared to be the most significant factors. The positive effect of the pore-forming material proportion on absorbance measurement confirmed its significance in the elimination of organic matter. The compression ratio had a negative effect. A high compression ratio would therefore be unfavorable for reducing absorbance values, as evidenced by the obtained results.
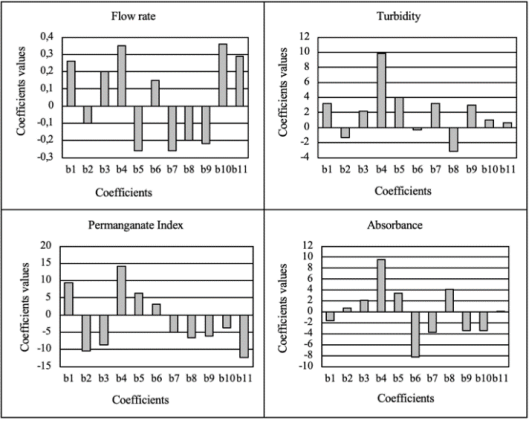
Figure 3. Bar charts of the model coefficients (Flow rate, Turbidity, Index, Permanganate, and Absorbance).
3.3. Influent Factors
To better understand the effects of the various factors studied, it is possible to break down the variation in responses based on the contributions made by each of these factors. These different contributions are shown cumulatively in Figure 4. The analysis of Figure 4 allowed for an overall classification of the factors into three categories: important parameters, non-negligible parameters, and negligible parameters for all responses. This classification was carried out based on the average weights of the cumulative factors across all responses.
Then we had:
Important parameters: proportion of pore-forming material (X4)
Non-negligible parameters (in order of importance given the answers obtained): Compression ratio (X6), hydraulic head (X11), Silver (disinfection) (X5), clay material (X1), filter thickness (X10), the ramp-up (X7), sintering temperature (X8), sintering time (X9);
Negligible parameters: Granulometry (X3), pore-forming material (X2).
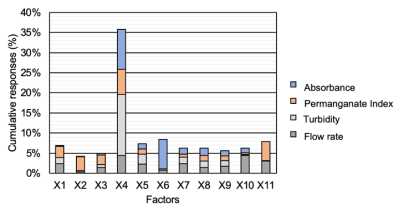
Figure 4. Cumulative contributions of the factors on the responses.
Table 9. Experimental factors fixed after the Plackett-Burman Design plan.

Facteurs

Fixed value

Clay Material

A2

Pore-Forming Material

Sawdust

Granulometry

500 - 800 µm

Silver (disinfection)

0

Compression Ratio

5%

Temperature ramp

2°C/min

Sintering Temperature

850°C

Sintering Time

1h

Filter Thickness

1cm

In the experimental setup used for factor screening, the proportion of pore-forming material was found to be the most influential parameter on the results. This parameter was therefore logically retained for the rest of the experiments. Moreover, given the importance of the hydraulic head in filtration techniques, this parameter was also retained. Compression ratio only really had an effect on absorbance, where a high compression ratio implied a low absorbance value. It was therefore decided to use a paste compression ratio of 5%. Since the use of silver did not have a significant effect, itw as excluded from the further study. The A2 clay material was chosen for the rest of the tests. With regard to the thickness of the filters, we noted that this parameter had no significant effect on the responses (turbidity, absorbance and permanganate index). A value of 10 mm was retained. This thickness choice also facilitated proper positioning at the membrane/filter interface. The ramp-up rate was kept at 2°C/min, and the sintering temperature was set at 850°C. The sintering time was maintained at 1 hour. The pore-forming material and its particle size showed minimal influence on the results, so the respective values were retained: sawdust, and 500 to 800 µm.
The Plackett-Burman Design plan highlighted the parameters with little influence on the process, allowing the selection of the most relevant ones for further study.
3.4. Optimization Through Central Composite Design
The results obtained after implementing the response surface design are presented in Table 10. Filtration rates ranged from 0.01 mL/s to 3.44 mL/s, turbidity removal varied between 78% and 95%, permanganate index removal ranged from 75% to 96%, and E. coli removal varied from 50% to 100%. These purification performances align with findings reported in the literature by authors .
Table 10. Experimental result from the Response Surface Plan.

Uncoded variables

Reponses

Position

Run

Proportion MP (%)

Hydraulic head (mCE)

Y1 Flow rate (mL/s)

Y2 Turbidity (%)

Y3 Permanganate Index (%)

Y4 E. coli Removal (%)

Factorials tests

1

15

0.50

0.17

90

80

100

2

25

0.50

0.20

80

90

80

3

15

2.00

1.88

90

70

100

4

25

2.00

1.9

82

85

60

Stars tests

5

13

1.25

0.14

95

60

90

6

27

1.25

0.19

78

75

50

7

20

0.19

0.01

84

96

99

8

20

2.31

3.44

87

96

92

Center tests

9

20

1.25

0.18

86

93

100

10

20

1.25

0.17

86

93

100

11

20

1.25

0.15

85

93

100

12

20

1.25

0.15

87

93

100

13

20

1.25

0.18

87

92

99

The distribution of these different results is shown on the boxplot in figure 5.
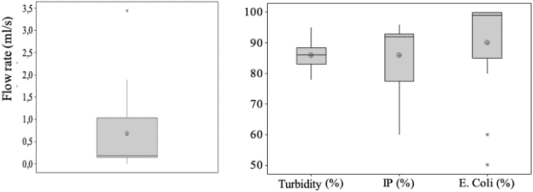
Figure 5. Boxplot of the responses.
The analysis of Figure 5 showed that experiment no. 8 exhibited an atypical measured flow rate value (represented by an asterisk on the boxplot). Additionally, the median (black line in the middle) and the mean (represented by the circled + symbol) were well separated, indicating that the range of test results for the "flow rate" response was not homogeneous. This suggested that there were more experiments with values lower than the average flow rate.
Two outliers were also observed in the E. coli measurements (experiments no. 4 and no. 6), while the other values for this response were distributed around the mean.
In contrast, the other responses (turbidity and permanganate index) exhibited homogeneous distributions with no outliers.
3.5. Modelization
The four responses (Y1 for flow rate (mL/s), Y2 for turbidity removal (%), Y3 for permanganate index removal (%), and Y4 for E. coli removal (%)) were correlated with the two factors, namely the proportion of pore-forming material (X1) and hydraulic head (X2), using a second-degree polynomial model. The resulting regression models are presented as follows:
Y1=0.96-0.032X1-2.177X2+0.00091X12+1.427X22-0.0007X1X2 (4)
(R2=97.92%;R2ajusted=96.43%)
Y2=108.33-1.258X1+0.48X2+0.0010X12-0.844X22+0.133X1X2(5)
(R2=96.42%;R2ajusted=93.86%)
Y3=-119.2+21.18X1-15.72X2-0.5110X12+2.62X22+0.333X1X2(6)
(R2=97.97%;R2ajusted=96.52%)
Y4=-102.8+21.69X1+28.74X2-0.5735X12-2.82X22-1.333X1X2 (7)
(R2=99.25%;R2ajusted=98.72%)
The coefficients of factors X1, X2, and X3 represent the linear effects, while the coefficients of factors X1X2 represent the interaction effects, and X1², X2² represent the quadratic effects.
3.6. Models Validation
The different R² and adjusted R² values are the coefficients of determination, with adjusted R² being the most appropriate in the presence of multiple explanatory variables, as in the present case. The obtained models were statistically significant at the 5% threshold. To assess the descriptive quality of the model, goodness-of-fit graphs were plotted. These graphs are presented in Figure 6.
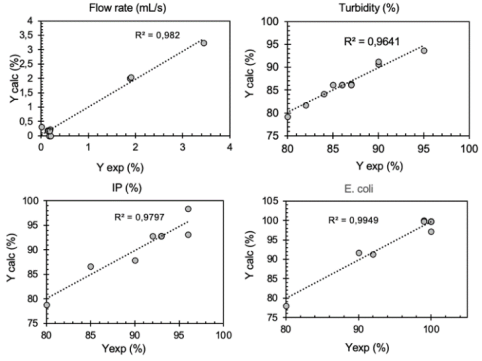
Figure 6. Goodness-of-fit graphs illustrating the correlation between experimental responses (Yexp) and calculated responses (Ycalc).
The models had a high R² values (R² > 95%), indicating that the predictive capabilities of the models was significant. The results of the analysis of variance for these models are presented in Table 11. A model is considered well-fitted if the sum of squares due to residuals is less than one-third of the sum of squares due to regression. In this case, the analysis of variance showed that the sum of squares of the residuals was much lower than the sum of squares for the models, indicating that the model was well-fitted. Moreover, we observed near-zero probability values. In Minitab, the closer the probability is to zero, the better the model. Given that the chosen significance threshold was 5%. A probability value less than 5% indicates the statistical validity of the model. This result further supported the conclusions derived from the goodness-of-fit graphs.
Table 11. Analysis of variance for the second-degree models.

Reponses

Source of variation

Sum of squares

Degrees of freedom

Squares medium

Probability

Y1: Flow rate (mL/s)

Regression

13.0610

5

2.61219

0.000

Residue

0.2776

7

0.03965

Total

13.3385

12

Y2: Turbidity (%)

Regression

228.432

5

45.686

0.000

Residue

8.491

7

1.213

Total

236.923

12

Y3: IP (%)

Regression

1506.47

5

301.29

0.000

Residue

31.22

7

4.46

Total

1537.69

12

Y4: E. coli (%)

Regression

3340.85

5

668.17

0.000

Residue

25.15

7

3.59

Total

12

The coefficients were then estimated by comparing the probabilities associated with them (P-Value) to the defined threshold. The probabilities associated with the different model coefficients are presented in Table 12.
The analysis of Table 11 allowed us to determine whether a lower-degree model can be used to describe a given response. For instance, a first-degree model could have been selected for Y2, as the quadratic effects and interactions exhibit P-values well above 0.05 (5%). However, to identify an optimal solution across multiple criteria, which is the objective of this study, software such as Minitab requires that all responses be modeled using the same type of equation. Consequently, a second-degree polynomial model was chosen for all responses.
This table also revealed that the factors influencing:
The Flow rate was the hydraulic head (both linear and quadratic);
The Turbidity was primarily the proportion of pore-forming material, followed by the hydraulic head (linear);
The permanganate index (IP) was the proportion of pore-forming material (both linear and quadratic), followed by the hydraulic head (linear).
The elimination of E. coli was influenced by the proportion of pore-forming material (both linear and quadratic), followed by the hydraulic head (linear) and the interaction between the proportion of pore-forming material and the hydraulic head.
Table 12. Coefficient Analysis Table with P-values.

Reponses

Effects

Parameters

P-Value

Y1: Flow rate (mL/s)

Constante

-

Linear

X1

0.836

X2

0.000

Quadratic

X12

0.773

X22

0.000

Interactions

X1X2

0.981

Y2: Turbidity (mL/s)

Constante

-

Linear

X1

0.000

X2

0.085

Quadratic

X12

0.954

X22

0.293

Interactions

X1X2

0.394

Y3: IP (%)

Constante

-

Linear

X1

0.000

X2

0.040

Quadratic

X12

0.000

X22

0.108

Interactions

X1X2

0.275

Y4: E. coli (%)

Constante

-

Linear

X1

0.000

X2

0.001

Quadratic

X12

0.000

X22

0.063

Interactions

X1X2

0.001

Multiple response optimisation.
The final objective of applying the design of experiments method is to be able to find optimal conditions for the desired answers. Thus, table 13 presents various scenarios as well as the associated optimal conditions, determined using the minitab 17 software.
Table 13. Multi-response optimization scenarios.

Scénarios

Optimales Conditions

Expected responses

Scenario 1: Maximize the filtration flow rate

Proportion MP: 27%

Hydraulic head 2.31%

Desirability 0.96

Flow rate: 3.29 mL/s

Scénario 2: Maximize turbidity removal

Proportion MP: 12.93%

Hydraulic head: 1.30

Desirability 0.92

Turbidity (removal): 93.69%

Scénario 3: Maximize the reduction of the permanganate index

Proportion MP: 20.79%

Hydraulic head: 0.19 mCE

Desirability: 1

IP (Removal): 98.72%

Scénario 4: Maximize the removal of E. coli

Proportion MP: 17.93%

Hydraulic head: 0.85mcE

Desirability: 1

E. coli (Removal): 100%

Scénario 5: Optimize the implementation conditions to maximize all responses

Option 1

Proportion MP: 17.93%

Hydraulic head 2.31mcE

Desirability: 0.80

Flow rate: 3.23 mL/s

Turbidity (Removal): 88.24%

IP (Removal): 87.78%

E. coli (Removal): 97.84%

Option 2

Proportion MP: 16.89%

Hydraulic head 2.31 mCE

Desirability 0.79

Flow rate: 3.23 mL/s

Turbidity (Removal): 89.19%

IP (Removal): 83.46%

E. coli (Removal): 99.25%

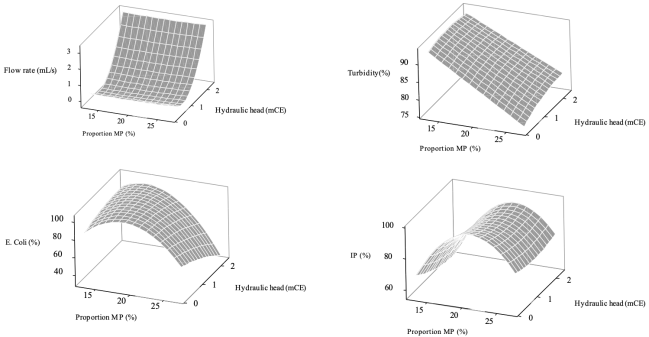
Figure 7. Response surface curves.
The graphical representation of the response surfaces of the models allowed a clear identification of the optimal areas that maximize the various removal efficiency (Figure 7). Here are the observations made:
High flow rate values are achieved at high hydraulic heads;
The highest turbidity removal efficacity occured when the proportions of pore-forming materials are low;
The proportion of pore-forming material and the applied hydraulic head jointly influence the plasticity index. Proportions of pore-forming materials between 20% and 25% tend to yield the best elimination or reduction percentages of the IP;
E. coli elimination was greater at lower proportions of pore-forming material, while the hydraulic head tended to decrease this elimination.
Depending on the quality of the water to be treated, the defined treatment objectives, and the operating conditions, these findings could guide the choice of filter formulation.
4. Conclusions
Developing efficient ceramic water filters for household water treatment remains a crucial and contemporary challenge. Various factors affect and influence the performance of these filters. To systematically analyze these factors, the design of experiments (DOE) approach was employed, first for screening and then for optimization. Screening was conducted using a Plackett-Burman design, which identified two key factors significantly affecting filter performance: the proportion of pore-forming material during fabrication and the hydraulic head applied during operation. A central composite design was then implemented to assess their effects on four key responses: flow rate, turbidity, permanganate index, and E. coli removal. The following conclusions were drawn from this analysis: (1) High flow rates are achieved at higher hydraulic heads; (2) Optimal turbidity reduction occurs when lower proportions of pore-forming material are used; (3) The permanganate index is jointly influenced by the proportion of pore-forming material and hydraulic head. The best reduction percentages are observed when the pore-forming material ranges between 20% and 25%; (4) E. coli removal efficiency is higher at lower proportions of pore-forming material, while an increase in hydraulic head tends to decrease bacterial removal. Beyond confirming trends previously reported in the literature, this study provided predictive models that enable the tailored design of ceramic filters within the studied experimental domain, aligning their fabrication with specific water treatment objectives.
Abbreviations

CDD

Central Composite Design

DOE

Design Of Experiment

NTU

Nephelometric Turbidity Unit

OFAT

One factor At a time

PBD

Plackett-Burman Design

PI

Permanganate Index (PI)

RSM

Response Surface Methodology

WHO

World Health Organization

Conflicts of Interest
The authors declare no conflicts of interest.
References
[1] Akowanou, A. V. O., & Aina, M. P. (2022). Ceramic water filter as a household water treatment system. In Encyclopedia of the UN Sustainable Development Goals (pp. 61–71).
[2] Akowanou, A. V. O., Aïna, M. P., Groendijk, L., & Yao, K. B. (2016). Application de l’impression 3D à l’élaboration de filtres en céramique pouvant servir au traitement de l’eau au point d’utilisation. Déchets, Sciences et Techniques, 2016(71), 2–9.
[3] Akowanou, A. V. O., Aina, M. P., Groendijk, L., & Yao, B. K. (2016). Household water treatment in Benin: Current/local practices. European Journal of Scientific Research, 142(2), 246–256.
[4] Bain, R., Cronk, R., Hossain, R., Bonjour, S., Onda, K., Wright, J., Yang, H., Slaymaker, T., Hunter, P., Prüss-Ustün, A., & Bartram, J. (2014). Global assessment of exposure to faecal contamination through drinking water based on a systematic review. Tropical Medicine & International Health, 19(8), 917–927.
[5] Wolf, J., Prüss-Ustün, A., Cumming, O., Bartram, J., Bonjour, S., Cairncross, S., Clasen, T., Colford, J. M., Curtis, V., De France, J., Fewtrell, L., Freeman, M. C., Gordon, B., Hunter, P. R., Jeandron, A., Johnston, R. B., Mäusezahl, D., Mathers, C., Neira, M., & Higgins, J. P. T. (2014). Systematic review: Assessing the impact of drinking water and sanitation on diarrhoeal disease in low- and middle-income settings: Systematic review and meta-regression. Tropical Medicine and International Health, 19(8), 928–942.
[6] Wolf, J., Bonjour, S., & Prüss-Ustün, A. (2013). An exploration of multilevel modeling for estimating access to drinking-water and sanitation. Journal of Water and Health, 11(1), 64–77.
[7] Venis, R. A., & Basu, O. D. (2020). Mechanisms and efficacy of disinfection in ceramic water filters: A critical review. Critical Reviews in Environmental Science and Technology, 0(0), 1–41.
[8] Clasen, T. F., Brown, J., & Collin, S. M. (2006). Preventing diarrhoea with household ceramic water filters: assessment of a pilot project in Bolivia. International Journal of Environmental Health Research, 16(3), 231–239.
[9] Clasen, T. F., Brown, J., Collin, S., Suntura, O., & Cairncross, S. (2004). Reducing diarrhea through the use of household-based ceramic water filters: a randomized, controlled trial in rural Bolivia. American Journal of Tropical Medicine and Hygiene, 70(6), 651–657.
[10] Akosile, S. I., Ajibade, F. O., Lasisi, K. H., Ajibade, T. F., Adewumi, J. R., Babatola, J. O., & Oguntuase, A. M. (2020). Performance evaluation of locally produced ceramic filters for household water treatment in Nigeria. Scientific African, 7, e00218.
[11] Akowanou, A. V. O., Deguenon, H. E. J., Groendijk, L., Aina, M. P., Yao, B. K., Drogui, P. 3D-Printed Clay-Based Ceramic Water Filters for Point-of-Use Water Treatment Applications. Progress in Additive Manufacturing. 2019, 4, 315–321.
[12] Rayner, J., Zhang, H., Schubert, J., Lennon, P., Lantagne, D., Oyanedel-Craver, V. Laboratory Investigation into the Effect of Silver Application on the Bacterial Removal Efficacy of Filter Material for Use on Locally Produced Ceramic Water Filters for Household Drinking Water Treatment. Unpublished/Journal Name Not Provided. 2013.
[13] Brown, J., Sobsey, M. D. Microbiological Effectiveness of Locally Produced Ceramic Filters for Drinking Water Treatment in Cambodia. Journal of Water and Health. 2010, 8(1), 1–10.
[14] Salvinelli, C., Elmore, A. C., Reidmeyer, M. R., Drake, K. D., Ahmad, K. I. Characterization of the Relationship Between Ceramic Pot Filter Water Production and Turbidity in Source Water. Water Research. 2016, 104, 28–33.
[15] Simonis, J. J., Basson, A. K. Manufacturing a Low-Cost Ceramic Water Filter and Filter System for the Elimination of Common Pathogenic Bacteria. Physics and Chemistry of the Earth, Parts A/B/C. 2012, 50–52, 269–276.
[16] Mittelman, A. M., Lantagne, D. S., Rayner, J., Pennell, K. D. Silver Dissolution and Release from Ceramic Water Filters. Environmental Science & Technology. 2015, 49(14), 8515–8522.
[17] Mahunon, S. E. R., Aina, M. P., Akowanou, A. V. O., Kouassi, E. K., Yao, B. K., Adouby, K., Drogui, P. Optimization Process of Organic Matter Removal from Wastewater by Using Eichhornia crassipes. Environmental Science and Pollution Research. 2018, 25, 29219–29226.
[18] Daouda, M. M. A., Akowanou, A. V. O., Mahunon, S. E. R., Adjinda, C. K., Aina, M. P., Drogui, P. Optimal Removal of Diclofenac and Amoxicillin by Activated Carbon Prepared from Coconut Shell Through Response Surface Methodology. South African Journal of Chemical Engineering. 2021, 38, 78–89.
[19] Shadan, B., Jafari, A., Gharibshahi, R. Enhanced Drilling Waste-Water Treatment Through Magnetic Nano-Composite Coagulant Application: A Central Composite Design Study. Heliyon. 2024, 10, e40450.
[20] Kumar, S., Drogui, P., Tyagi, R. D. Application of Central Composite Design for Commercial Laundry Wastewater Treatment by Packed Bed Electrocoagulation Using Sacrificial Iron Electrodes. Chemosphere. 2024, 368, 143729.
[21] Kumar, D. S., Bhavitha, K., Harani, A., Meenakshi, V., Rajendran, P., Lee, I. E., Al Awadh, M., Yuheng, L., Prasad, N. E. C. Green Analytical Comparison and Central Composite Design Optimization for Simultaneous Estimation of Pain Management Drugs Using RP-Liquid Chromatography. Microchemical Journal. 2025, 208, 112309.
[22] Gonçalves, I. L., de Menezes Filho, F. C. M., de Morais, E. B., de Castro, V. A., Canales, F. A. Optimization of the Use of Moringa oleifera in Wastewater Treatment by Rotational Central Composite Design. Desalination and Water Treatment. 2024, 320, 100765.
[23] Akowanou, A. V. O., Aina, M. P., Mahunon, S. E. R., Yao, B. K. Characterization of Clays from the “Sè” Region in the South of Benin Used to Make Ceramic Water Filters. American Journal of Applied Chemistry. 2017, 5, 90.
[24] van der Laan, H., van Halem, D., Smeets, P. W. M. H., Soppe, A. I. A., Kroesbergen, J., Wubbels, G., Nederstigt, J., Gensburger, I., Heijman, S. G. J. Bacteria and Virus Removal Effectiveness of Ceramic Pot Filters with Different Silver Applications in a Long Term Experiment. Water Research. 2014, 51, 47–54.
[25] Pérez-Vidal, A., Diaz-Gomez, J., Castellanos-Rozo, J., Usaquen-Perilla, O. L. Long-Term Evaluation of the Performance of Four Point-of-Use Water Filters. Water Research. 2016, 98, 176–182.
Cite This Article
  • APA Style

    Akowanou, A. V. O., Hounkpe, S. P., Deguenon, H. E. J., Aina, M. P. (2025). Modelling and Optimization of Ceramic Water Filter Using Experimental Design. American Journal of Applied Chemistry, 13(3), 47-62. https://doi.org/10.11648/j.ajac.20251303.11

    Copy | Download

    ACS Style

    Akowanou, A. V. O.; Hounkpe, S. P.; Deguenon, H. E. J.; Aina, M. P. Modelling and Optimization of Ceramic Water Filter Using Experimental Design. Am. J. Appl. Chem. 2025, 13(3), 47-62. doi: 10.11648/j.ajac.20251303.11

    Copy | Download

    AMA Style

    Akowanou AVO, Hounkpe SP, Deguenon HEJ, Aina MP. Modelling and Optimization of Ceramic Water Filter Using Experimental Design. Am J Appl Chem. 2025;13(3):47-62. doi: 10.11648/j.ajac.20251303.11

    Copy | Download

  • @article{10.11648/j.ajac.20251303.11,
      author = {Akuemaho Virgile Onésime Akowanou and Sena Peace Hounkpe and Hontonho Esperance Justine Deguenon and Martin Pepin Aina},
      title = {Modelling and Optimization of Ceramic Water Filter Using Experimental Design},
      journal = {American Journal of Applied Chemistry},
      volume = {13},
      number = {3},
      pages = {47-62},
      doi = {10.11648/j.ajac.20251303.11},
      url = {https://doi.org/10.11648/j.ajac.20251303.11},
      eprint = {https://article.sciencepublishinggroup.com/pdf/10.11648.j.ajac.20251303.11},
      abstract = {This study aimed to model and optimize the design of a ceramic water filter using an experimental design approach. The ceramic filter was fabricated from raw clay sourced from the Sè region, while rice husk and sawdust, served as the pore-forming material. The optimization process began with a screening of 11 factors using a screening design, followed by optimization through response surface methodology. The optimizations were performed using Minitab 17.1 software. The responses considered were water flow rate, turbidity, permanganate index, and absorbance at 254 nm. The results showed that filtration rates ranged from 0.01 mL/s to 3.44 mL/s, turbidity removal varied between 78% and 95%, permanganate index removal ranged from 75% to 96%, and E. coli removal was between 50% and 100%. The following conclusions were drawn from the experiment: (1) high flow rate values were achieved at higher hydraulic heads; (2) higher turbidity values occurred when the proportion of pore-forming material was low; (3) the proportion of pore-forming material and the applied hydraulic head jointly influenced the plasticity index; (4) proportions of pore-forming material between 20% and 25% tended to provide the highest reduction in the permanganate index; (5) E. coli removal was higher at lower proportions of pore-forming material, but the hydraulic head tended to reduce this removal. These findings offer new insights into the use of experimental design methodologies for the fabrication of ceramic water filters.},
     year = {2025}
    }
    

    Copy | Download

  • TY  - JOUR
    T1  - Modelling and Optimization of Ceramic Water Filter Using Experimental Design
    AU  - Akuemaho Virgile Onésime Akowanou
    AU  - Sena Peace Hounkpe
    AU  - Hontonho Esperance Justine Deguenon
    AU  - Martin Pepin Aina
    Y1  - 2025/06/23
    PY  - 2025
    N1  - https://doi.org/10.11648/j.ajac.20251303.11
    DO  - 10.11648/j.ajac.20251303.11
    T2  - American Journal of Applied Chemistry
    JF  - American Journal of Applied Chemistry
    JO  - American Journal of Applied Chemistry
    SP  - 47
    EP  - 62
    PB  - Science Publishing Group
    SN  - 2330-8745
    UR  - https://doi.org/10.11648/j.ajac.20251303.11
    AB  - This study aimed to model and optimize the design of a ceramic water filter using an experimental design approach. The ceramic filter was fabricated from raw clay sourced from the Sè region, while rice husk and sawdust, served as the pore-forming material. The optimization process began with a screening of 11 factors using a screening design, followed by optimization through response surface methodology. The optimizations were performed using Minitab 17.1 software. The responses considered were water flow rate, turbidity, permanganate index, and absorbance at 254 nm. The results showed that filtration rates ranged from 0.01 mL/s to 3.44 mL/s, turbidity removal varied between 78% and 95%, permanganate index removal ranged from 75% to 96%, and E. coli removal was between 50% and 100%. The following conclusions were drawn from the experiment: (1) high flow rate values were achieved at higher hydraulic heads; (2) higher turbidity values occurred when the proportion of pore-forming material was low; (3) the proportion of pore-forming material and the applied hydraulic head jointly influenced the plasticity index; (4) proportions of pore-forming material between 20% and 25% tended to provide the highest reduction in the permanganate index; (5) E. coli removal was higher at lower proportions of pore-forming material, but the hydraulic head tended to reduce this removal. These findings offer new insights into the use of experimental design methodologies for the fabrication of ceramic water filters.
    VL  - 13
    IS  - 3
    ER  - 

    Copy | Download

Author Information
  • Abstract
  • Keywords
  • Document Sections

    1. 1. Introduction
    2. 2. Materials and Methods
    3. 3. Results and Discussions
    4. 4. Conclusions
    Show Full Outline
  • Abbreviations
  • Conflicts of Interest
  • References
  • Cite This Article
  • Author Information