Research Article | | Peer-Reviewed

Recycling of Waste PET Plastic on Asphalt, by Using Application of Response Surface Methodology: Effect of Production Process Parameters

Received: 9 May 2024    Accepted: 30 May 2024    Published: 19 June 2024
Views:       Downloads:
Abstract

Plastic, polymers of variable compositions have become object of common use and difficult to digest by micro-organisms, especially single-use plastic waste, such as polyethylene terephthalate (PET) water canisters. These polymers are source of environmental pollution. Therefore, it is important to manage theme in the good way to protect environment. In this study, different conditions of waste plastic PET (Polyethylene Terephthalate) recycling on asphalt were optimized. Response Surface Methodology (RSM) using the Doehlert experimental design has been employed in the optimization. The independent variables considered were bitumen (5-8%), PET (0-12%), Mixing temperature (150-160°C) and Mixing time (20-30min). Four-second order polynomial models were generated. The responses obtained by the models were well described as: specific density (Y.SD), penetrability (Y.P), softening point (Y.SP), and flash point (Y.FP) of the process with satisfactory fits in terms of absolute average deviation, bias factor and accuracy factor. The optimum responses were 1,04 as specificity gravity (Y.SG), 60*(1/10mm) as penetrability at 25°C, 100g and 5sec (Y.P), 50°C as softening point (Y.SP), and 242°C as flash point (Y.FP). The statistical relation between the four independent variables and the process responses were well described.

Published in American Journal of Applied Chemistry (Volume 12, Issue 2)
DOI 10.11648/j.ajac.20241202.12
Page(s) 47-57
Creative Commons

This is an Open Access article, distributed under the terms of the Creative Commons Attribution 4.0 International License (http://creativecommons.org/licenses/by/4.0/), which permits unrestricted use, distribution and reproduction in any medium or format, provided the original work is properly cited.

Copyright

Copyright © The Author(s), 2024. Published by Science Publishing Group

Keywords

Optimization, RSM- Doehlert Experimental Design, Blending Condition, Recycling, Waste Plastic, PET, Asphalt Modified, Physicochemical Characteristics

1. Introduction
Plastic, polymers of variable compositions have become object of common use and difficult to digest by micro-organisms. These polymers are a source of environmental pollution . Chad is no exception from this type of pollutant due to the lack of a reliable household waste management policy, waste plastic made up of polyethylene terephthalate is thrown into the environment with no lesser consequences on the ecosystem . One of the best and most effective methods of managing of waste plastic is the possibility of incorporating it into construction processes . In general case, to recycle this waste, two processes emerge: the dry method (coating plastic on the hot aggregate and then mixing with asphalt) and the wet method (mixing powdery plastic waste with asphalt then mixing with aggregate) . Through these processes, PET are easily recyclable because of their high melting point (about 260°C). The latter, is one of the characteristics which determines the choice of process considered in relation to the types of plastic waste to be recycled . The wet process is better for controlling the properties of the modified asphalt binder. Although this process requires specialized mixing and storage facilities . Also, due to of its enhanced thermal behavior, the wet process is currently the most widely used for polymer asphalt modification. Composed of complex molecules, the adhesion of plastic waste into bitumen requires a specific time, generally around 20 to 30min . Likewise, in order to obtain perfect homogenization, the size of plastic plays an important role. It was suggested to use plastic size less than 2,36mm and the optimum asphalt ratio should be up to 10% . Despite the fact that plastic waste improves asphalt properties, this process has some limitations to explain the influences of the raw materials (waste PET and asphalt) on the best optimum condition.
Thus, the present article is devoted to the study of the optimization conditions of recycling waste plastic PET on asphalt by using application of response surface methodology. The aim of process is to identify relation between the in-put parameter (factor) and their effect on the responses (out-put). This can help to choose the good factor for a specify researched characteristic.
2. Materials and methods
2.1. Material
The materials used within the scope of this article are:
1. Waste PET powder size 0 to 0,63mm
2. Asphalt with grade 60/70; 1,03g/cm³ as specific density,
3. 46°C as softening point and 235°C as flash point.
To obtain PET on powder form, the plastic bottle was washed, dried and melted about 260°C which is PET melting point, then pouring at ambient air. After solidifying, the plastic was grinded and sifted. The plastic with granulometry included 0-0,63mm were used to mix with hot bitumen as shown in Figure 1. The suggested ratio of bitumen was 5 to 8% . Wet process of recycling of waste plastic was done here. It is constituted by a mixture of PET plastic powder and the bitumen binder .
2.2. Mixing Condition
According to literature review, plastic waste can be used in hot mix to improve physical properties of bituminous, aggregate and mix by ‘Dry Process’ or ‘Wet Process’. As we need to determine, the influence of some factors which can influence the tests analyses, we opt for wet process. Because of chemical characteristics of asphalt and PET, this method can give more information about optimization condition of recycling waste plastic on asphalt. The process was done by blending PET powder and asphalt. To get mix binder, PET obtained by substitution of asphalt in different ratio (0-12%) was added to hot asphalt. The mix was stirred for 20 to 30min with temperature about 150°C to 160°C as shown in figure 1. This process was intended to make some physicals analyses and to find out a good optimum condition of waste PET recycling on asphalt by using Doehlert response surface methodology.
2.3. Response Surface Methodology (RSM)
Optimization studies using response surface methodology (RSM) were deeply investigated . Furthermore, the optimum conditions could assist designers to manufacture simple unit operations that could limit or eliminate the tedious practice of recycling PET on asphalt (rate of waste PET, asphalt, mixing temperature and time). Then absolute average deviation (AAD) and coefficient of determination (R²) could draw to investigate the adequacy of the proposed models. The present study involves optimization of some parameters that are likely to affect asphalt which can be used for asphalt concrete formulation.
The general practice of determining these optima is by one variable-at-time approach. One of the disadvantages of this approach is that it does not include interaction effects among the variables and is unable to determine the true optimum conditions. In order to overcome this problem, optimization studies were done using response surface methodology. RMS is a collection of mathematical and statistical technique that is useful for modeling and analyzing situations in which a response of interest is influenced by several variables, especially if there is a need to optimize the responses of a process. Doehlert matrix as an experimental design represents a uniform distribution of experimental points in space of coded variables as shown on table 1.
It is used particularly when there is a need to cover an experimental domain of any form of uniformly distributed points in order to explore the total domain (margins and interiors). Moreover, it permits to follow in a sequential manner in studying a response surface of second degree. Polynomial equations with and without interaction could be proposed as models for the mentioned processes. A few studies have been reported on the recycling of waste plastic on asphalt.
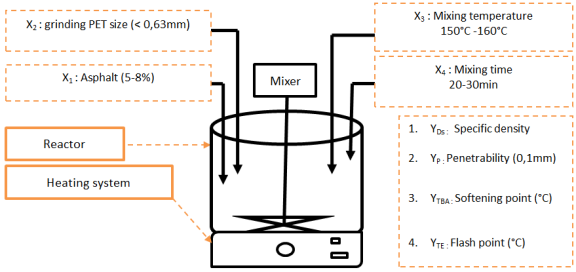
Figure 1. Schematic of recycling process of waste PET.
It seemed to be important to study the rate of optimal PET, obtained by asphalt substitution and the good mixing temperature and time which define the best binding. The objective of this study was to evaluate the influence of asphalt, PET, mixing temperature and time on asphalt modified, which can be used to make concrete asphalt formulation. The second preoccupation was to assess the good binding condition to obtain the best properties in terms of the response functions: specific gravity (Y.SD), penetrability (Y.P), softening point (Y.SP), and flash point (Y.FP).
Table 1. Doehlert experimental design of four independent variables employed to recycle PET.

Tests number

Asphalt (%) x1‘(X1)

PET (%) x2‘(X2)

Mixing Temperature (°C) x3‘(X3)

Mixing time (Min) x4‘(X4)

1

7 (0.000)

6 (0.000)

155 (0.000)

25 (0.000)

2

8 (1.000)

6 (0.000)

155 (0.000)

25 (0.000)

3

5 (-1.000)

6 (0.000)

155 (0.000)

25 (0.000)

4

7 (0,500)

11 (0.866)

155 (0.000)

25 (0.000)

5

6 (-0,500)

1 (-0.866)

155 (0.000)

25 (0.000)

6

7 (0.500)

1 (-0.866)

155 (0.000)

25 (0.000)

7

6 (-0,500)

11 (0.866)

155 (0.000)

25 (0.000)

8

7 (0,500)

8 (0.289)

159 (0,816)

25 (0.000)

9

6 (-0,500)

4 (-0.289)

151 (-0.816)

25 (0.000)

10

7 (0,500)

4 (-0.289)

151 (-0.816)

25 (0.000)

11

7 (0.000)

9 (0.577)

151 (-0.816)

25 (0.000)

12

6 (-0,500)

8 (0.289)

159 (0.816)

25 (0.000)

13

7 (0.000)

3 (-0.577)

159 (0.816)

25 (0.000)

14

7 (0.500)

8 (0.289)

156 (0.204)

29 (0.791)

15

6 (-0.500)

4 (-0.289)

154 (-0.204)

21 (-0.791)

16

7 (0.500)

4 (-0.289)

154 (-0.204)

21 (-0.791)

17

7 (0.000)

9 (0.577)

154 (-0.204)

21 (-0.791)

18

7 (0.000)

6 (0.000)

158 (0.612)

21 (-0.791)

19

6 (-0.500)

8 (0.289)

156 (0.204)

29 (0.791)

20

7 (0.000)

3 (-0.577)

156 (0.204)

29 (0.791)

21

7 (0.000)

6 (0.000)

152 (-0.612)

29 (0.791)

x: coded value of variables and X: the real value of variables
2.4. Physicochemical Analysis of Asphalt Binder
2.4.1. Determination of Specific Gravity
This test, according to NFT 66-007, is defined as the ratio of the mass of a given volume of a material to equal volume of water. The specific gravity is one of the fundamental proprieties of bitumen binder. It informs us about the mineral impurity which can be present in bitumen specimen. Specific gravity is going with Archimedes principle: If a solid material is first weighed in air and then weighed after immersing it in water, then the difference in the two weights gives the volume of water displaced by the solid material.
Generally, pycnometer was used to calculate the density as the following formula:
SG=(C-A)B-A-(D-C)(1)
With;
A: Weight of pycnometer
B: Weight of pycnometer filled with water
C: Weight of pycnometer part filled with bitumen
D: Weight of pycnometer + Bitumen + Water
2.4.2. Determination of Penetrability
This test is used to get information about consistency and the grade of asphalt by penetration test (NFT 66-004). It gets information about the hardness or softness of asphalt by measuring the depth in tenths of a millimeter to which a standard loaded needle will penetrate vertically in 5 seconds under specified temperature, load and duration of loading.
2.4.3. Determination of Softening Point
The softening point of bitumen or tar is the temperature at which the substance attains a particular degree of softening. It can be defined also as the temperature at which a bitumen can no longer support a steel ball with 3,5g as the weight and fall at which a standard ball passes through a sample of bitumen in a mold and falls through a height of 2.5 cm in certain condition. This test helps to know the temperature up to which a bituminous binder should be heated for various road use applications. Softening point is determined by ring and ball apparatus (NFT 66-008).
2.4.4. Determination of Flash Point
Depending of asphalt grades, this hydrocarbon leaves out volatiles, mostly at high temperatures. This fact can be characterized by a flash point. According to NFT 66-118, this test is defined as the lowest temperature at which the vapor of bitumen momentarily catches fire in the form of flash under specified test conditions. This test provides information on the level of light components in a given mixture.
Validation and Optimization of waste PET recycling
2.5. Validation
To express the fit of second-degree equations, the determination coefficient R² was used. This coefficient of determination was insufficient for model validation on its own. The absolute average deviation (AAD) was required to validate a model, as was the use of the bias factor and the accuracy factor. As a result, the model validation criterion was calculated using the formulas:
AAD=i=1n(/Yi,exp- Yi, theo/Yi, exp)n(2)
Bf=101/ni=1n   log(Yi, theo   Yi, exp)(3)
Af=101/ni=1n   /log(Yi, theo   Yi, exp)/    (4)
Where:
AAD, absolute average deviation; Bf, bias factor; Af, accuracy factor; Yi, Theo, response obtained using the model; Yi, exp, response obtained via experiment and n, number of trials.
The acceptable values of those applications must be within the following ranges: AAD, 0-0.3; Bf, 0.75-1.25, and Af, 0.75-1.25.
2.6. Optimization Condition
The response surface methodology using Doehlert experimental matrix was used to optimize recycling of PET on asphaltic road. Minitab version 19, Sigma Plot version 14 and Excel, were used for statistical analysis, regression models and graphical optimization. Besides, the fit of models was verified by the coefficient of determination (R²), the absolute average deviation (AAD), Bf (Bias Factor) and Af, (Accuracy Factor). Four independent variables namely Asphalt (X1: 5-8%), PET (X2: 0 – 12%), Mixing temperature (X3: 150-160°C) and the Mixing time (X4: 20-30min) were chosen. The range of independent parameters were selected based on literature review and preliminary studies. Twenty-one different experiments were presented in according to the experimental design for the four parameters. The experiments were figured in coded (x) and real (X) values.
The response functions (Yi) measured were: specific gravity (Y.SG), penetrability (Y.P), softening point (Y. SP), and flash point (Y. FP). These were related to the coded values (xi) by the second order polynomial that shown in equation (5).
Yi=bo+i=1 kbiXi+i=1kbiiXi2+i=1k-1*j=i+1kbijXiXj (5)
The coefficients of the polynomial were represented by b0 (constant term), xi (linear effects), xii (quadratic effects) and xij (interaction effects). Xi and Xj are the independent variables. The analyses of variance were generated and the effect and regression coefficients of individual, quadratic and interaction terms were determined. The significances of all terms in the polynomial were judged statistically at a probability (P) of lower than 0.05 (P<0.05). The regression coefficients were then used to make statistical calculation to generate contour map and response surface graphs from the regression models.
2.7. Recycling Procedure
In each experiment of recycling of used PET plastic in asphalt, 500g of mixed of the cooked sample were used to get information about: Gravity specific at 27°C, Penetrability at 25°C, 100g 5sec in 1/10mm, Softening point (°C) and Flash Point (°C).
Table 2. Influences of Asphalt and PET ratio, mixing temperature and mixing time on the responses of modified binder.

Asphalt (%) X1

PET (%) X2

Temperature (°c) X3

Time (min)X4

Specific Density

Penetrability at 25°c, 100g 5sec (1/10mm)

Softening point (°C)

Flash point (°C)

1

6,50

6

155

25

1,06

58

48

245

2

8,00

6

155

25

1,06

58

48

245

3

5,00

6

155

25

1,06

58

48

245

4

7,25

11

155

25

1,10

44

55

258

5

5,75

1

155

25

1,03

67

46

235

6

7,25

1

155

25

1,03

67

46

235

7

5,75

11

155

25

1,10

44

55

258

8

7,25

8

159

25

1,08

53

50

252

9

5,75

4

151

25

1,05

60

48

243

10

7,25

4

151

25

1,05

60

48

243

11

6,50

9

151

25

1,10

52

54

255

12

5,75

8

159

25

1,08

53

50

252

13

6,50

3

159

25

1,04

66

46

240

14

7,25

8

156

29

1,08

52

53

254

15

5,75

4

154

21

1,04

62

47

236

16

7,25

4

154

21

1,04

62

47

236

17

6,50

9

154

21

1,07

57

53

248

18

6,50

6

158

21

1,05

60

47

240

19

5,75

8

156

29

1,08

52

53

254

20

6,50

3

156

29

1,05

62

47

242

21

6,50

6

152

29

1,09

55

49

246

3. Results and Discussion
The influence of operating parameters (Bitumen, PET, Mixing Temperature and Mixing Time) on the recycling of PET in the asphalt was determined. The findings were provided in Table 2. The models linked singular factors, quadratic and interactions of the parameters effects to responses variables were consisted of: Specific density, penetrability, softening point and flash point.
The results of the analysis of variance, goodness of fit and the adequacy of models were summarized in Table 3. The data showed a good fit with the equation 5, which were statistically acceptable at P < 0.05 level. The values of coefficient of determination (R²) for the SG, P, SP and FP are respectively 0,97; 0,98, 0,98 and 0,99. These values of R² showed that the proposed models of all responses are adequate. In fact, it was suggested that, for a good fit of a model, R² should be at least 0,8 . On the one hand, it’s reported that the closer the value of R² to the unity, the better the empirical models . On the other hand, the absolute average deviation (AAD), bias factor (Bf) and accuracy factor (Af) must be including the range of 0-0.3; 0.75-1.25, and 0.75-1.25 respectively . According to table 3, the values for, SG, P, SP and FP confirm the adequacy of the models. So, the models could be used to generate surface response curves to explain the influence of the independent factors on the responses studied.
Table 3. Regression coefficients, coefficient of determination (R²), absolute average deviation (AAD), bias factor (Bf) and accuracy factor (Af) for the four responses of PET recycling.

Coefficient/factors

Specificity Gravity (g/cm³)

Penetrability at 25°C, 100g 5sec in 1/10mm

Softening Point (°C)

Flash Point (°C)

CONSTANTE

0,000

0,000

0,000

0,000

FACTORS

Probability

X1

1,000

1,000

1,000

1,000

X2

0,000

0,000

0,000

0,000

X3

0,450

0,995

0,076

0,023

X4

0,002

0,005

0,006

0,000

X1*X1

1,000

1,000

1,000

1,000

X2*X2

0,456

0,147

0,007

0,064

X3*X3

0,345

0,935

0,201

0,009

X4*X4

0,904

0,879

0,108

0,069

X1*X2

1,000

1,000

1,000

1,000

X1*X3

1,000

1,000

1,000

1,000

X1*X4

1,000

1,000

1,000

1,000

X2*X3

0,612

0,067

0,796

0,476

X2*X4

0,704

0,147

0,213

0,591

X3*X4

0,209

0,576

0,021

0,004

0,97

0,98

0,98

0,99

AAD

0,00

0,01

0,01

0,00

Bf

1,00

1,00

1,00

1,00

Af

1,00

1,01

1,01

1,00

P<0.05/ AAD, 0-0.3 / B,0.75-1.25/ Af, 0.75-1.25.
YSD= 1,06000 + 0,00000 x1 + 0,04800 x2 - 0,00302 x3 + 0,01996 x4
+ 0,00000 x1*x1+ 0,0089 x2*x2 + 0,0125 x3*x3 + 0,0016 x4*x4 + 0,00000 x1*x2
+ 0,0000 x1*x3+ 0,0000 x1*x4 - 0,0067 x2*x3 + 0,0053 x2*x4 - 0,0200 x3*x4
Y.P= 58,00 + 0,000 x1 - 14,001 x2 + 0,006 x3
- 3,991 x4 + 0,00 x1*x1 - 4,44 x2*x2- 0,25 x3*x3
+ 0,48 x4*x4 - 0,00 x1*x2 - 0,00 x1*x3
+ 0,00 x1*x4 - 6,67 x2*x3- 5,32 x2*x4 + 2,00 x3*x4
Y.Sp= 48,000 - 0,000 x1 + 6,534 x2 - 0,804 x3 + 1,596 x4
- 0,000 x1*x1 + 4,44 x2*x2+ 1,75 x3*x3 + 2,39 x4*x4 - 0,000 x1*x2
+ 0,00 x1*x3 + 0,00 x1*x4 - 0,34 x2*x3+ 1,86 x2*x4 + 4,40 x3*x4
Y.FP= 245,000 - 0,000 x1 + 15,601 x2 + 1,195 x3
+ 7,187 x4 + 0,000 x1*x1 + 2,67 x2*x2+ 4,89 x3*x3
- 2,95 x4*x4 + 0,000 x1*x2 - 0,00 x1*x3 + 0,00 x1*x4
+ 1,00 x2*x3+ 0,80 x2*x4 + 6,60 x3*x4
With,
Y.SD: Gravity; Y. P: Penetration; Y. SP; Y. FP: Flash Point; X1: Asphalt; X2: PET; X3: Mixing Temperature and X4: Mixing Time.
3.1. Specific Density
The specific gravity of bitumen increases significantly (P=0.000, Table 3) from 1.02 to 1.1, while the PET rate increases from 0 to 12% (Figure 2). This increase is probably due to the fact that the density of PET (1.34–1.39 g/cm³) is much higher than that of asphalt (1.05 g/cm³), making bitumen consistent. Thus, the density of the mixture is affected, because there is the contact of materials of different characteristics . Although temperature does not have a significant effect on density, it greatly affects the volume of PET and consequently impacts the density of the bitumen. This phenomenon was observed in a recent study . Indeed, at high concentrations, polymers have the ability to absorb maltenes from bitumen, resulting in an increase in the volume of the mixture by forming a high-density polymer-rich phase .
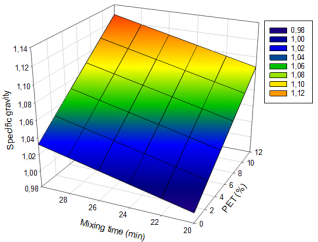
Figure 2. Evolution of specific gravity as a function of mixing time and PET ratio.
In addition, the density of bitumen increased significantly (P=0.002, Table 3) from 1.02 to 1.04; when the mixing time is increased from 20 to 30 minutes (Figure 2). This phenomenon can be explained by the fact that time is an essential factor for the kinetics of reactions. In fact, a longer mixing time increases the possibility of the PET adhering properly to the bitumen, which in turn increases the exchange surface between the materials. On the other hand, a reduction in mixing time would limit the intimate contact between PET and bitumen, which can discourage the homogenization of the medium by reducing the density. These changes are consistent with those reported by various research .
3.2. Penetrability
The penetrability of modified bitumen decreased significantly when the PET% rate (P=0.000, Table 3) increased from 0-12%. This decrease makes sense because the density of bitumen increases with the increase in PET content. Indeed, density and penetrability are two related phenomena. Thus, the increase in the PET content makes bitumen more consistent through the absorption of its lighter components, in this case maltenes (Figure 2), which results in the hardening of the latter. However, a bitumen hardens, resists better penetration or pressure that could be exerted by the penetrability needle, so the grade of the bitumen drops from the highest to the lowest. At 0% PET (Figure 3), the bitumen grade is 70 (1/10 mm), while at 6%, this grade increases to 60 (1/10 mm). With an incorporation rate of 12% PET, the bitumen grade drops to 40 (1/10 mm), resulting in bitumen too hard to be used. This finding corroborates previous research. Indeed, the incorporation of plastic waste at a rate greater than 7% has a negative impact on the penetrability of bitumen, in the sense that the latter can lose its binding properties as well as its plasticity . However, the significant effect observed on the decrease in penetrability of bitumen caused (P=0.005, Table 3) by increasing mixing time is that time is a factor that increases the probability of PET interaction with hot bitumen.
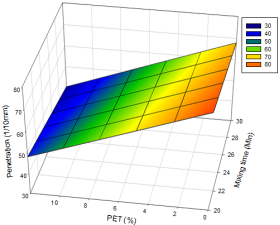
Figure 3. Evolution of penetrability as a function of mixing time and PET levels.
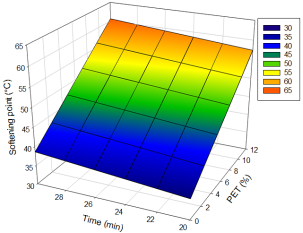
Figure 4. Evolution of Softening point as a function of mixing time and PET levels.
3.3. Softening point
The softening point (SP) of modified bitumen increased significantly when the PET rate (P=0.000, Table 3) and the mixing time (P=0.006, Table 3) increased by 0-12% and 20-30 min respectively (Figure 4). The increase in the SP as a function of the PET ratio is mainly due to the consistency of the bitumen. Indeed, pure bitumen is a non-Newtonian fluid, which can therefore see its viscosity drop greatly in the presence of heat and applied load stress (balls). However, if on the one hand the incorporation of PET ratio has the effect of increasing its consistency, the longevity of the mixing time allows, on the other hand, a good homogenization of the medium . Thus, the SP increases and allows the bitumen to both withstand the load and thus improve its characteristics at high temperatures, which could increase rutting resistance . These results corroborate the numerous studies carried out in this direction .
In addition, the X3X4 interaction (temperature and mixing time) significantly increases (P=0.021, Table 3) the ball-ring softening temperature of PET-modified bitumen. In fact, this effect was simultaneously accentuated by an increase in temperature and mixing time. When the mixing time and temperature are 25 min and 155°C respectively (Figure 5), the SP accepts a value of 48°C, on the other hand, when the mixing time is longer (30 minutes) and the modified bitumen is heated up to 160°C, the SP increases to 52°C. Indeed, a longer mixing time will increase the probability of a good dispersion and homogenization of PET in the bitumen while making the medium consistent. However, an increase in temperature would allow the bitumen to have a good viscosity, which would facilitate the adhesion of PET by making the mixture more rigid. Indeed, the rise in temperature undoubtedly leads to the disordered movement of the molecules (maltenes and asphaltenes) contained in the bitumen, which favors the expansion of the bitumen in order to better exchange with the PET and thus increase the SP.
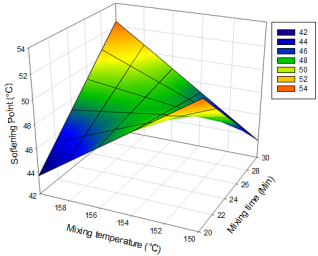
Figure 5. Effect of mixing time and temperature interaction on Softening point
3.4. Flash Point
The flash point of the modified bitumen increased significantly when the PET content (P=0.000, Table 3) and the mixing temperature (P=0.023, Table 3), increased by 0-12% and by 150 to 160°C respectively (Figure 6). This change is likely caused by the increase in bitumen consistency with the addition of PET. Indeed, the increase in the PET ratio reduces the quantity of bitumen and consequently its lighter particles like maltenes, which results in an increase in flash point. On the other hand, the increase in the temperature of the mixture can cause an oxidation reaction of the bitumen that can transform the maltenes into heavier asphaltenes, which also has the effect of increasing the lighting temperature. Recent similar studies confirm this trend .
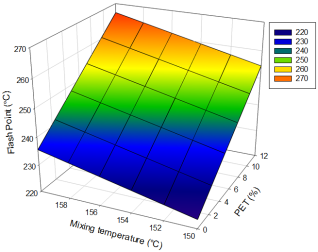
Figure 6. Evolution of flash point as a function of the PET content and the mixing temperature.
Similarly, the flash temperature of the modified bitumen increased significantly when the PET content (P=0.000, Table 3) and the mixing time (P=0.000, Table 3), increased by 0-12% and 20-30min respectively (Figure 7). As shown in Figure 2 the gravity of modified bitumen increases as a result of the combined effect of mixing time and PET content. This increase in density plays a major role in the composition of the modified binder obtained, in that a change in the structure of the bitumen is observed. Thus, the increase in the PET ration favors, on the one hand, the contribution of new semi-crystalline and less volatile particles in the composition of the mixture. On the other hand, it is obvious that the substitution of PET for bitumen reduces the quantity of volatile matter within the modified binder, which results in an increase in the flash point.
In addition, the X3X4 interaction (temperature and mixing time) significantly increases (P=0.004, Table 3) the flash point of the modified bitumen by PET.
In fact, this effect was accentuated simultaneously by an increase in temperature and mixing time. When the mixing time and temperature are respectively 25 min and 155°C (Figure 8), the flash point (FP) assumes a value of 246°C, on the other hand, when the mixing time is longer (30 minutes) and the modified bitumen is heated up to 160°C, the flash point increases up to 252°C. The increase in FP in proportion to the increase in mixing time and temperature further explains how cured polymer-modified bitumen when the homogenization time is long and becomes heavier by oxidation and transformation of its light components under the effect of heat .
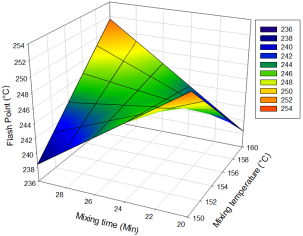
Figure 8. Effect of mixing time and temperature interaction on illumination temperature.
3.5. Optimization
In order to improve the performance of bitumen using powdery PET waste on the one hand and to define the optimal process condition on the other hand, a graphical optimization was carried out using Sigma Plot software and Excel. Such a methodology consists of superimposing the contour lines obtained from Doehlert's experimental design according to the specific criteria imposed. The optimal condition has been defined in order to obtain the best way and a better understanding of the requirements for recycling PET in bitumen, the desired normative qualities of which are mentioned in Table 4.
Table 4. Properties and Specifications of Pure Bitumen.

Characteristics

Specific gravity

Penetrability (25°C, 100g 5sec in 1/10mm)

Softening point (°C)

Flash point (°C)

Specification

NFT 66-007

NFT 66-004

NFT 66-008

NFT 66-118

Limit values

1,0-1,1

60-70

43-56

˃230

To achieve the optimal conditions for PET recycling, multi-response optimization was performed using Minitab. SG, P, SP, and FP are all optimized for this purpose. At the end of this optimization, the compromise is as follows: asphalt rate 5%; PET rate 6%; Mixing temperature 154°C and Mixing time 22min.
This combination yielded responses as follows: 1.04 g/cm³ density (Y. SD); 60*(1/10mm) penetrability at 25°C, 100g and 5sec (Y.P); 50°C softening point (Y.SP) and 242°C flash point (Y.FP).
The composite desirability of this study indicates the value of 0.91, which is still closer to 1. This value proves that, on the one hand, the parameters seem to produce favorable results for all responses as a whole. On the other hand, individual desirability indicated that responses such as SD, P, SP and FP remain relevant and therefore more effective in terms of target values of 0.99; 0,78; 0.99 and 0.91 respectively.
4. Conclusion
This part of the study examined the physicochemical properties of PET polymer-modified asphalt by using the response surface methodology, particularly Doehlert's experimental designs. It appeared that the incorporation of PET plastic powder as a dope in asphalt made it possible to obtain a bituminous binder with good characteristics in terms of penetrability, softening temperature, specific gravity and flash point. This may justify the relevant choice of such a process in order to solve two equations: plastic pollution and the improvement of the quality of pavements. So, this technique has greatly affected penetrability and specific gravity, indicating that excess PET can make bitumen less cohesive and adhesive. However, the conditions under which these PET were incorporated into the bitumen led to an optimal formulation. The fact that the desirability of the study's composite (0.91) is so close to 1 suggests that the parameters appeared to yield positive results for all responses taken as a whole.
Abbreviations

PET

Polyethylene Terephthalate

AAD

Average Deviation

Bf

Bias Factor

Af

Accuracy Factor

SG

Specific Gravity

P

Penetrability

SP

Softening Point

FP

Flash Point

RMS

Response Methodology Surface

Author Contributions
Hassan Alaguid Ibrahim Sofo: Conceptualization, Data curation, Formal Analysis, Funding acquisition, Investigation, Methodology, Validation, Visualization, Writing – original draft, Writing – review & editing
Mohagir Ahmed Mohammed: Project administration, Resources, Software, Supervision, Validation, Visualization, Writing – review & editing
Batran Sidick: Resources, Software, Supervision, Validation, Visualization, Writing – original draft, Writing – review & editing
Conflicts of Interest
The authors declare no conflicts of interest.
References
[1] Baş, D. &. (2007). Modeling and optimization i: Usability of response surface.
[2] Burak Sengoz, G. I. (2008). Evaluation of the properties and microstructure of SBS and EVA polymer modified bitumen. ScienceDirect, Pages 1897-1905.
[3] Cahit Gürer, U. F. (2022). Investigation of using conductive asphalt concrete with carbon fiber additives in intelligent anti-icing systems. International Journal of Pavement Engineering, 1-28.
[4] Chahinaz, T. A. (2020). valorisation des dechets plastiques dans la fabrication des bitumes routiers.
[5] Dalhat, & M. A. (2017). Performance of recycled plastic waste modified asphalt binder in Saudi Arabia. Int. J. International Journal of Pavement Engineering, 18, 349–357.
[6] Fang. (2014). Preparation process to affect stability in waste polyethylene-modified bitumen. Constr. Build. Mater., 54, 320–325.
[7] Fengchi Xu, Y. Z. (2021). Using Waste Plastics as Asphalt Modifier: A Review.
[8] G. Liataud, E. B. (1984). Guide pratique de dimensionnement des chaussées pour les pays tropicaux. CEBTP.
[9] Houénou KOWANOU, D. A. (2014). « Effets de l’incorporation du fondu de déchets de sachets plastiques sur la consistance du bitume et la stabilité du béton bitumineux. Afrique SCIENCE 10(2) (2014) 39 - 52.
[10] Academie des sciences, d. l. (2021). Les plastiques dans l’Environnement ( Combattre la pollution plastique JME).
[11] Joglekar, A. a. (1987). “Product excellence through design of experiments”.
[12] Kadlezir Fiacre, M. A. (2023). Application of response surface methodology in date (Phoenix dactylifera L.) juice.
[13] MEPDD, M. d. (2021). Les plastiques dans l'environnement.
[14] Mohagir A. M, B. N. (2010). Optimisation of Kernels Preparation Conditions Involved in the Press Extraction of Shea.
[15] Mohayminul et al, M. I. (2021). Modification of Bitumen Properties Using Waste Polymer in Context of Bangladesh. International Journal of Mineral Processing and Extractive Metallurgy, 7-11.
[16] Naskar, M., Chaki, T., & Reddy, K. (2010). Effect of waste plastic as modifier on thermal stability and degradation kinetics of bitumen/waste plastics blend. Thermochim. Acta , 509, 128–134.
[17] Pérez-Lepe., Martínez-Boza, F., & Gallegos, C. (2005). Influence of Polymer Concentration on the Microstructure and Rheological Properties of High-Density Polyethylene (HDPE)-Modified Bitumen. Energy Fuels, 19, 1148–1152.
[18] R. N. Hunter, A. S. (2015). The Shell bitumen handbook. Fifth edition.
[19] Ranieri, L., C., Oliveira, J. R. M., Silva, H., & Celauro, C. (2017). Asphalt Surface Mixtures with Improved Performance Using Waste Polymers via Dry and Wet Processes. Journal of Materials in Civil Engineering, PP29.
[20] Rondón, Q. H. (2019). Influence of mixing time and temperature in hot mix asphalt stiffness during asphalt modification. International Journal of Civil Engineering and Technology (IJCIET), 216-224.
[21] Sahidharam, Manu, Torboghan, D. M., & Burrow, D. M. (2019). Using plastic in road pavement.
Cite This Article
  • APA Style

    Sofo, H. A. I., Mohammed, M. A., Sidick, B. (2024). Recycling of Waste PET Plastic on Asphalt, by Using Application of Response Surface Methodology: Effect of Production Process Parameters. American Journal of Applied Chemistry, 12(2), 47-57. https://doi.org/10.11648/j.ajac.20241202.12

    Copy | Download

    ACS Style

    Sofo, H. A. I.; Mohammed, M. A.; Sidick, B. Recycling of Waste PET Plastic on Asphalt, by Using Application of Response Surface Methodology: Effect of Production Process Parameters. Am. J. Appl. Chem. 2024, 12(2), 47-57. doi: 10.11648/j.ajac.20241202.12

    Copy | Download

    AMA Style

    Sofo HAI, Mohammed MA, Sidick B. Recycling of Waste PET Plastic on Asphalt, by Using Application of Response Surface Methodology: Effect of Production Process Parameters. Am J Appl Chem. 2024;12(2):47-57. doi: 10.11648/j.ajac.20241202.12

    Copy | Download

  • @article{10.11648/j.ajac.20241202.12,
      author = {Hassan Alaguid Ibrahim Sofo and Mohagir Ahmed Mohammed and Batran Sidick},
      title = {Recycling of Waste PET Plastic on Asphalt, by Using Application of Response Surface Methodology: Effect of Production Process Parameters
    },
      journal = {American Journal of Applied Chemistry},
      volume = {12},
      number = {2},
      pages = {47-57},
      doi = {10.11648/j.ajac.20241202.12},
      url = {https://doi.org/10.11648/j.ajac.20241202.12},
      eprint = {https://article.sciencepublishinggroup.com/pdf/10.11648.j.ajac.20241202.12},
      abstract = {Plastic, polymers of variable compositions have become object of common use and difficult to digest by micro-organisms, especially single-use plastic waste, such as polyethylene terephthalate (PET) water canisters. These polymers are source of environmental pollution. Therefore, it is important to manage theme in the good way to protect environment. In this study, different conditions of waste plastic PET (Polyethylene Terephthalate) recycling on asphalt were optimized. Response Surface Methodology (RSM) using the Doehlert experimental design has been employed in the optimization. The independent variables considered were bitumen (5-8%), PET (0-12%), Mixing temperature (150-160°C) and Mixing time (20-30min). Four-second order polynomial models were generated. The responses obtained by the models were well described as: specific density (Y.SD), penetrability (Y.P), softening point (Y.SP), and flash point (Y.FP) of the process with satisfactory fits in terms of absolute average deviation, bias factor and accuracy factor. The optimum responses were 1,04 as specificity gravity (Y.SG), 60*(1/10mm) as penetrability at 25°C, 100g and 5sec (Y.P), 50°C as softening point (Y.SP), and 242°C as flash point (Y.FP). The statistical relation between the four independent variables and the process responses were well described.
    },
     year = {2024}
    }
    

    Copy | Download

  • TY  - JOUR
    T1  - Recycling of Waste PET Plastic on Asphalt, by Using Application of Response Surface Methodology: Effect of Production Process Parameters
    
    AU  - Hassan Alaguid Ibrahim Sofo
    AU  - Mohagir Ahmed Mohammed
    AU  - Batran Sidick
    Y1  - 2024/06/19
    PY  - 2024
    N1  - https://doi.org/10.11648/j.ajac.20241202.12
    DO  - 10.11648/j.ajac.20241202.12
    T2  - American Journal of Applied Chemistry
    JF  - American Journal of Applied Chemistry
    JO  - American Journal of Applied Chemistry
    SP  - 47
    EP  - 57
    PB  - Science Publishing Group
    SN  - 2330-8745
    UR  - https://doi.org/10.11648/j.ajac.20241202.12
    AB  - Plastic, polymers of variable compositions have become object of common use and difficult to digest by micro-organisms, especially single-use plastic waste, such as polyethylene terephthalate (PET) water canisters. These polymers are source of environmental pollution. Therefore, it is important to manage theme in the good way to protect environment. In this study, different conditions of waste plastic PET (Polyethylene Terephthalate) recycling on asphalt were optimized. Response Surface Methodology (RSM) using the Doehlert experimental design has been employed in the optimization. The independent variables considered were bitumen (5-8%), PET (0-12%), Mixing temperature (150-160°C) and Mixing time (20-30min). Four-second order polynomial models were generated. The responses obtained by the models were well described as: specific density (Y.SD), penetrability (Y.P), softening point (Y.SP), and flash point (Y.FP) of the process with satisfactory fits in terms of absolute average deviation, bias factor and accuracy factor. The optimum responses were 1,04 as specificity gravity (Y.SG), 60*(1/10mm) as penetrability at 25°C, 100g and 5sec (Y.P), 50°C as softening point (Y.SP), and 242°C as flash point (Y.FP). The statistical relation between the four independent variables and the process responses were well described.
    
    VL  - 12
    IS  - 2
    ER  - 

    Copy | Download

Author Information
  • Abstract
  • Keywords
  • Document Sections

    1. 1. Introduction
    2. 2. Materials and methods
    3. 3. Results and Discussion
    4. 4. Conclusion
    Show Full Outline
  • Abbreviations
  • Author Contributions
  • Conflicts of Interest
  • References
  • Cite This Article
  • Author Information