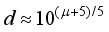
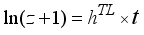
Hubble diagrams are examined for SN1a supernovae in the redshift range z = 0.01–1.3 and for gamma ray bursts in the range z = 0.034–8.1. It is shown that in the low redshift range, the Hubble diagram shows an innate equivocality between the ΛCDM and the tired light model. This means that the strong agreement between the z/µ data, calculated with the parameters of the ΛCDM model, and the experimentally measured z/µ values cannot be considered as definite evidence for the expansion hypothesis. The exponential function z+1 = eh(TL) × t(d) which is characteristic of the tired light redshift mechanism, fits the data with similarly high accuracy. Hence, on the premise of low redshift data, a decision for or against either model is completely arbitrary. We expect that in the high RS range it should be possible to check more precisely whether the HD follows the linear H0D/c or the exponential relation, an effect that is not perceptible in the z< 1 region. Unfortunately, SN1a supernovae data are accessible only to a limited range of distances. This constraints on the data motivated several attempts to obtain cosmological parameters from gamma ray bursts observations. GRBs are the most brilliant sources in the universe. Tey are acquired up to RSs of ~8 and higher, and endeavours are made to use GRB data to calculate HD. In this study a total of 138 calibrated, cosmology independent GRB z/μ data points collected by Liu and Wei from the 557 Union2 compilations were used as the starting data set. It is shown that the Hubble diagram for high redshift gamma ray bursts shows poor agreement with the ΛCDM model, but concurs with the exponential energy decay following from the tired light redshift hypothesis.
| Published in | American Journal of Astronomy and Astrophysics (Volume 12, Issue 3) |
| DOI | 10.11648/j.ajaa.20251203.17 |
| Page(s) | 126-134 |
| Creative Commons |
This is an Open Access article, distributed under the terms of the Creative Commons Attribution 4.0 International License (http://creativecommons.org/licenses/by/4.0/), which permits unrestricted use, distribution and reproduction in any medium or format, provided the original work is properly cited. |
| Copyright |
Copyright © The Author(s), 2025. Published by Science Publishing Group |
Distances and Redshifts, Galaxies, High-redshift, Gamma Ray Bursts, Cosmological Parameters
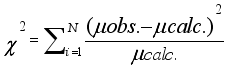
 (1)
(1)  (2)
(2) Data set | (b) | (c) | (d) |
|---|---|---|---|
No. of data points | 138 | 193 | 134 |
z range | 0.031–8.1 | 0.03354–8.1 | 1.48–9.3 |
Data points z ≥ 5 | 6 | 5 | 5 |
R2 | 0.8746 | 0.7848 | 0.8241 |
∑χ2 (best fit: obs) | 1.9193 | 5.1282 | 2.8849 |
∑χ2/data point | 0.0139 | 0.02657 | 0.02153 |
Standard deviation | 2.196 | 2.2256 | 2.2623 |
 (3)
(3)  (4)
(4)  (5)
(5)  (6)
(6)  (7)
(7)  . This leads to a linear relationship for the variables
  (8)
(8)  (9)
(9) Parameter 1 | Parameter 2 | Parameter 3 | Parameter 0 | |
|---|---|---|---|---|
log fit | 0.1009 | 0.6274 | 6.3167 | 44.111 |
ln fit | −855.33 | 1366.6 | 4397.4 | 0 |
Fit coordinates | ∑χ2µcalc: µ fit | R2 | P test | Chiqu-test | F test |
|---|---|---|---|---|---|
log(z)/µ | 2.673×10⁻⁵ | 1 | 0.9999985 | 1 | 0.9987774 |
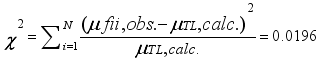
ln(z+1)/t | 1.810×10⁻⁶ | 1 | 1 | 1 | 0.9987774 |
Model | Calculated data | ln fit | log fit |
|---|---|---|---|
h | 0.6322 | 0.6322 | 0.6319 |
R2 | 0.99967 | 0.99967 | 0.99948 |
hCDM | hTL | hTL/hCDM |
|---|---|---|
73 | 65.92 | 0.9031 |
70 | 63.22 | 0.9031 |
68 | 61.41 | 0.9031 |
Model, calc. µ | hCDM = 0.70 | hTL = 0.66 | hTL = 0.70 |
|---|---|---|---|
∑ χ2 µobs/µcalc | 1.9415 | 1.9397 | 1.9923 |
Parameter 1 | Parameter 2 | Parameter 3 | Parameter 0 | R2 |
|---|---|---|---|---|
0.133 | 0.3156 | 5.8286 | 44.0533 | 0.8746 |
 , and
, and 

 (10)
(10) 
H0 | 70 km Mpc-1 s-1 |
h | H0/100 km Mpc-1 s-1 = 0.7 |
HD | Hubble Diagram |
RS | Redshift |
GRB | Gamma Ray Burst |
| [1] | Hubble E. P., 1929, A relation between distance and radial velocity among extra-galactic nebulae, Proceedings of the National Academy of Sciences of the United States of America, vol. 15, no. 3, pp. 167–173, |
| [2] | Sorrell, W. H., 2009, Misconceptions about the Hubble recession law, Astrophysics and Space Science 323, 205–211, |
| [3] | Marosi L. A., 2013, Hubble diagram test of expanding and static cosmological models: The Case for a slowly expanding flat universe, Advances in Astronomy, Article ID 917104, |
| [4] | Zwicky 1932, F. On the red shift of spectral lines through interstellar space. Proc. Natl Acad. Sci. USA 1929, 15, 773–77, |
| [5] | Traunmüller H., 2014, From magnitudes and redshifts of supernovae, their light-curves, and angular sizes of galaxies to a tenable cosmology, Astrophysics and Space Science 350, 755–767, |
| [6] | Schaefer B. E., 2007, The Hubble diagram to redshift > 6 from 69 gamma-ray bursts, Astrophys. J. 660, 16-46, arXiv: astro´- ph/0612285, 2006, |
| [7] | Schaefer, B. E., 2003, Gamma-ray burst Hubble diagram to z = 4.5, Ap. J. Lett. 583, L67, |
| [8] | Wei, H., 2010, Observational constraints on cosmological models with th e updated long gamma-ray bursts, Journal of Cosmology and Astroparticle Physics 2010 (8), arXiv.org/abs/1004.4951, |
| [9] | Amati L., D’Agostino R., Luongo O., Muccino M., Tantalo M., 2018, Addressing the circularity problem in the Ep−Eiso correlation of gamma-ray bursts, arXiv: 1811.08934 [astro-ph HE], |
| [10] | Marosi L. A., 2014, Hubble diagram test of 280 supernovae redshift data, Journal of Modern Physics 5, 1, |
| [11] | Marosi L. A., 2016, Modelling and analysis of the Hubble diagram of 280 type SNIa supernovae and gamma ray bursts redshifts with analytical and empirical redshift/magnitude functions, International Journal of Astronomy and Astrophysics 6, 3 |
| [12] | Marosi L. A., 2019, Extended Hubble diagram on the basis of gamma ray bur, sts including the high redshift range of z = 0.0331–8.1, International Journal of Astronomy and Astrophysics 9, 1, |
| [13] | Gupta R. P., 2019, Weighing cosmological models with SNe Ia and gamma ray burst redshift data, Universe 5, 102, |
| [14] | Shirokov, S. I., Sokolov, I. V., Lovyagin, N. Yu., Amati, L., Baryshev, Yu. V., Sokolov, V. V., & Gorokhov, V. L., 2020, High-redshift long gamma-ray bursts Hubble diagram as a test of basic cosmological relations, MNRAS 000 1–15, Preprint 23 June 2020, |
| [15] | Shirokov, S. I., Sokolov, I. V., Vlasyuk, V. V., Amati, L., Sokolov, V. V., & Baryshev, Yu. V., 2020b, THESEUS–BTA cosmological crucial tests using multimessenger gamma-ray bursts observations, Astrophysical Bulletin 75(3), 207–218, arXiv.2006.06488, |
| [16] | Betoule M. et al., 2014, Improved cosmological constraints from a joint analysis of the SDSS-II and SNLS supernova samples, arXiv: 1401.4064, [astro-ph-CO], |
| [17] | Liu J. & Wei H, 2015, Cosmological models and gamma-ray bursts calibrated by using Padé method, General Relativity and Gravitation 47, 141, |
| [18] | Demianski M., Piedipalumbo E., Sawant D., & Amati L., 2017, Cosmology with gamma-ray bursts, I. The Hubble diagram through the calibrated Ep,i–Eiso correlation, A&A, 598, A112, |
| [19] | Vigoureux, J. M., Vigoureux, B., & Langlois, M., 2014, An analytical expression for the Hubble diagram of supernovae and gamma-ray bursts, arXiv: 1411.3648v1, |
| [20] | Sandage A., S. Munch, A. Mampaso, and F. Sanches, The Universe at Large. Key Issues in Astronomy and Cosmology, 1997, Cambridge University Press, Cambridge, UK. |
| [21] | Sandage A. and Perlmutter J. M., The surface brightness test for the expansion of the μ, I—properties of Petrosian metric diameters, The Astrophysical Journal. (1990) 350, 481–491. |
| [22] | Sandage A. and Lubin L. M., The Tolman surface brightness test for the reality of the expansion, The Astronomical Journal. (2001) 121, no. 5, 2271–2288, 2-s2.0-0141543681, |
| [23] | Hubble E: P., Tolman R. C., 1935, Two mathods of investigating the nature of the redshift, The astrophysical Journal, 82, 302, |
| [24] | Alcock C. and Paczyński B. 1979 Nature 281 358, |
| [25] | López-Corredoira M., 2003, Observational cosmology: caveats and open questions in the standard model, |
| [26] | López-Corredoira M., Angular size test on the expansion of the Universe, International Journal of Modern Physics D. (2010) 19, no. 3, 245, |
| [27] | Crawford D. A., 2011, Observational evidence favors a static universe, The Journal of Cosmology. 13, 3875–3946. |
| [28] | LaViolette, P. A. 1986, Is the universe really expanding, The Astrophysical Journal, 301, 544 -553, S02022 |
| [29] | Lerner E. J., 2018, Observations contradict galaxy size and surface brightness predictions that are based on the expanding universe hypothesis, Monthly Notices of the Royal Astronomical Society, Volume 477, Issue 3, July 2018, Pages 3185–3196, |
| [30] | Gupta R. P., JWST early Universe observations and ΛCDM cosmology, Monthly Notices of the Royal Astronomical Society, Volume 524, Issue 3, September 2023, Pages 3385–3395, |
| [31] | Palmese, A., Bom, C. R., Mucesh, S. and Hartley, W. G, 2023, A Standard Siren Measurement of the Hubble Constant Using Gravitational-wave Events from the First Three LIGO/Virgo Observing Runs and the DESI Legacy Survey, ApJ 943, number 1, 56, |
| [32] | May 28, 2024 • by Marc Airhart, 2024, May 28, The latest news from the College of Natural Sciences at The University of Texas at Austin, Improved Method for Estimating the Hubble Constant with Gravitational Waves. |
| [33] | Deogharia, G., Roy, S., 2025, Four-Parameter χ2-Test Discloses a Suitable Hubble Parameter for Diffusive Interaction in the Dark Sector: Prediction of a Super-Exponentially Expanding Emergent Universe, Grav.Cosmol. 31 (2025) 2, 252-259. |
| [34] | Deogharia, G., Dutta, S., 2024, Super – Exponentially Accelerated Universe in a Friedmann – Lemaitre – Robertson – Walker metric, Gravit. Cosmol. 30, 312-322, |
APA Style
Marosi, L. A. (2025). Hubble Diagram Test of SN1a Supernovae and High Redshift Gamma Ray Bursts. American Journal of Astronomy and Astrophysics, 12(3), 126-134. https://doi.org/10.11648/j.ajaa.20251203.17
ACS Style
Marosi, L. A. Hubble Diagram Test of SN1a Supernovae and High Redshift Gamma Ray Bursts. Am. J. Astron. Astrophys. 2025, 12(3), 126-134. doi: 10.11648/j.ajaa.20251203.17
@article{10.11648/j.ajaa.20251203.17,
  author = {Laszlo Arpad Marosi},
  title = {Hubble Diagram Test of SN1a Supernovae and High Redshift Gamma Ray Bursts
},
  journal = {American Journal of Astronomy and Astrophysics},
  volume = {12},
  number = {3},
  pages = {126-134},
  doi = {10.11648/j.ajaa.20251203.17},
  url = {https://doi.org/10.11648/j.ajaa.20251203.17},
  eprint = {https://article.sciencepublishinggroup.com/pdf/10.11648.j.ajaa.20251203.17},
  abstract = {Hubble diagrams are examined for SN1a supernovae in the redshift range z = 0.01–1.3 and for gamma ray bursts in the range z = 0.034–8.1. It is shown that in the low redshift range, the Hubble diagram shows an innate equivocality between the ΛCDM and the tired light model. This means that the strong agreement between the z/µ data, calculated with the parameters of the ΛCDM model, and the experimentally measured z/µ values cannot be considered as definite evidence for the expansion hypothesis. The exponential function z+1 = eh(TL) × t(d) which is characteristic of the tired light redshift mechanism, fits the data with similarly high accuracy. Hence, on the premise of low redshift data, a decision for or against either model is completely arbitrary. We expect that in the high RS range it should be possible to check more precisely whether the HD follows the linear H0D/c or the exponential relation, an effect that is not perceptible in the z< 1 region. Unfortunately, SN1a supernovae data are accessible only to a limited range of distances. This constraints on the data motivated several attempts to obtain cosmological parameters from gamma ray bursts observations. GRBs are the most brilliant sources in the universe. Tey are acquired up to RSs of ~8 and higher, and endeavours are made to use GRB data to calculate HD. In this study a total of 138 calibrated, cosmology independent GRB z/μ data points collected by Liu and Wei from the 557 Union2 compilations were used as the starting data set. It is shown that the Hubble diagram for high redshift gamma ray bursts shows poor agreement with the ΛCDM model, but concurs with the exponential energy decay following from the tired light redshift hypothesis.
},
 year = {2025}
}
TY  - JOUR
T1  - Hubble Diagram Test of SN1a Supernovae and High Redshift Gamma Ray Bursts

AU  - Laszlo Arpad Marosi
Y1  - 2025/09/11
PY  - 2025
N1  - https://doi.org/10.11648/j.ajaa.20251203.17
DO  - 10.11648/j.ajaa.20251203.17
T2  - American Journal of Astronomy and Astrophysics
JF  - American Journal of Astronomy and Astrophysics
JO  - American Journal of Astronomy and Astrophysics
SP  - 126
EP  - 134
PB  - Science Publishing Group
SN  - 2376-4686
UR  - https://doi.org/10.11648/j.ajaa.20251203.17
AB  - Hubble diagrams are examined for SN1a supernovae in the redshift range z = 0.01–1.3 and for gamma ray bursts in the range z = 0.034–8.1. It is shown that in the low redshift range, the Hubble diagram shows an innate equivocality between the ΛCDM and the tired light model. This means that the strong agreement between the z/µ data, calculated with the parameters of the ΛCDM model, and the experimentally measured z/µ values cannot be considered as definite evidence for the expansion hypothesis. The exponential function z+1 = eh(TL) × t(d) which is characteristic of the tired light redshift mechanism, fits the data with similarly high accuracy. Hence, on the premise of low redshift data, a decision for or against either model is completely arbitrary. We expect that in the high RS range it should be possible to check more precisely whether the HD follows the linear H0D/c or the exponential relation, an effect that is not perceptible in the z< 1 region. Unfortunately, SN1a supernovae data are accessible only to a limited range of distances. This constraints on the data motivated several attempts to obtain cosmological parameters from gamma ray bursts observations. GRBs are the most brilliant sources in the universe. Tey are acquired up to RSs of ~8 and higher, and endeavours are made to use GRB data to calculate HD. In this study a total of 138 calibrated, cosmology independent GRB z/μ data points collected by Liu and Wei from the 557 Union2 compilations were used as the starting data set. It is shown that the Hubble diagram for high redshift gamma ray bursts shows poor agreement with the ΛCDM model, but concurs with the exponential energy decay following from the tired light redshift hypothesis.

VL  - 12
IS  - 3
ER  -
Independent Scholar, Ludwigshafen am Rhein, Germany
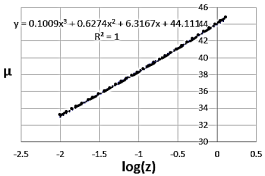
Figure 1.
log(z)/µ Hubble diagram for the 31 calculated z/µ data points.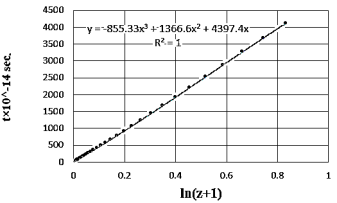
Figure 2.
ln(z+1)/t Hubble diagram for the 31 calculated z/d data points.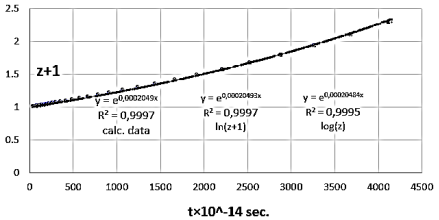
Figure 3. Linear HDs for the calculated data (dots) and for the log(z)/µ (triangles) and d/ln(z+1) (squares) models.
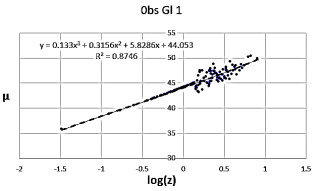
Figure 4.
Log(z)/µ Hubble diagram of the observed GRB data.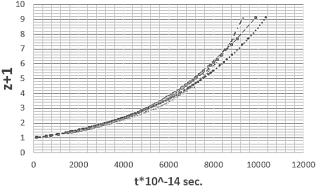
Figure 5.
hCDM = 0.7 (triangles), best fit of the observed data (squares).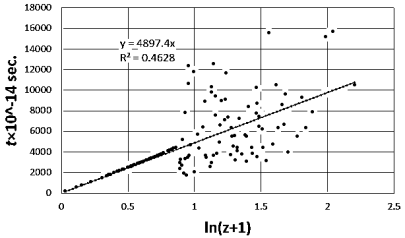
Figure 6.
Linear HD on the t/(z+1) scale of the observed GRB data.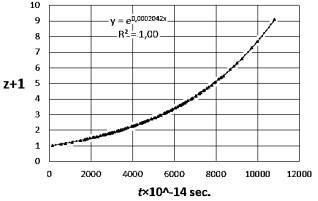
Figure 7.
t/ln(z+1) HD for the observed GRB data.Information

