Research Article | | Peer-Reviewed

Biophysical Resource Characterization, Identification and Prioritization of Major Constraints and Potentials of Gara Ebanu Community Watershed in Sululta District, Ethiopia

Received: 18 March 2024     Accepted: 16 April 2024     Published: 15 July 2024
Views:       Downloads:
Abstract

Baseline characterization helps to understand the initial livelihood condition of the people in the watershed before and after the intervention of the project to measure the amount of change attained by the project. The objective of the study was to characterize baseline information on the existing biophysical resource used as benchmark for planning and impact monitoring and to identify and major constraints and potential in the watershed. The watershed was selected depending on agro-ecological representation, prevalence of resource management and land degradation problems and accessibility for intensive follow-up. Based on the preliminary outlet identified during the watershed selection process, the watershed boundary was delineated using GPS data and the map of watershed was geo-referenced and digitized for its contour, roads, rivers, and other features. Both primary and secondary data were used for the study and primary data was collected through field observation, household survey, focus group discussion and interview of the key informants. From the total 103 household heads living in the watershed, 62 household heads were selected as a respondent for the study. The collected data was managed and analyzed using Statistical Package for Social Sciences (SPSS) and Microsoft excel 2010. The results of the study showed that about 29.4% of the watershed slope was characterized by flat lands, 45.7% moderate slope and 24.9% steep lands. As well as soil fertility status of cultivated land in the watershed were 33.9% low, 55.9% moderate and 10.2% high. The results of the study showed that the major constraints identified by sampled household heads were decline of soil fertility, soil erosion, climate change, land shortage, and deforestation were significantly contributed to the low crop yield in the watershed. About 27.4% of the sampled households had encountered decline of soil fertility problems, 25.8% of sample farmers encountered soil erosion problem, and 22.6% of sample farmers encountered climate change problem in the watershed. From the identified major constraints, the highest priorities were given for decline of soil fertility, soil erosion problem, shortage of feed and fodder, and decline of crop productivity respectively. In the watershed, immediate short-term actions should be taken particularly participatory integrated watershed management were recommended.

Published in Agriculture, Forestry and Fisheries (Volume 13, Issue 4)
DOI 10.11648/j.aff.20241304.11
Page(s) 94-105
Creative Commons

This is an Open Access article, distributed under the terms of the Creative Commons Attribution 4.0 International License (http://creativecommons.org/licenses/by/4.0/), which permits unrestricted use, distribution and reproduction in any medium or format, provided the original work is properly cited.

Copyright

Copyright © The Author(s), 2024. Published by Science Publishing Group

Keywords

Watershed, Characterization, Identification, Prioritization

1. Introduction
The worldwide agricultural production and productivity has been challenged with soil erosion related problems. Almost all lands in Sub-Sahara Africa (SSA) are prone to land degradation, and Ethiopia is among the most affected countries . In a casing land degradation, in any form, in Ethiopia has direct impact on water resources, livestock and crop production and productivity, unemployment and rural-urban migration, incidence of drought and ultimately on food security . Every year, about 10 million hectares of farm lands are abandoned globally and 6.5 million hectares in Africa . Due to water erosion, about 12 tons/ha of soils in lost every year in Ethiopia, and the economic impacts of this soil loss is estimated about $139 million which is 3–4% of agricultural growth domestic product (GDP) of the country . Soil erosion affects soil physical properties, and chemical properties that affect agricultural production . In addition, soil erosion causes adverse effect on atmosphere, agronomic productivity, food security and the overall life quality . To address the problem of land degradation in the country, government and non-governmental organizations have introduced different soil and water conservation measures since the 1970’s famine. However, due to the poor consultation and participation of local people in the planning and implementation of the practices, shortage of skilled human power and lack of state-of-the-art scientific approach, the natural resource management efforts were not as effective as desired to bring fundamental change . Understanding these, Ethiopian government has been promoted a watershed based natural resource development and management in the country as a suitable strategy for improving productivity and sustainable intensification of agriculture since 1980s.
Watershed development program has emerged as a new paradigm for sustainable natural resource management and rural livelihoods and it occupied the central step of natural resource management and rural development in the fragile and semi-arid environments of the developing nations. Management of natural resources at watershed scale produces multiple benefits in terms of increasing crop production with minimum disturbance to the environment, improving livelihoods, protecting environment, addressing gender and equity issues along with biodiversity concerns. It encompasses the all-inclusive approach to manage watershed resources that integrates forestry, agriculture, pasture and water management, which can be broadened to rural development with a strong link to the livelihoods of the local people . At the previous the idea of watershed management had a narrow emphasis primarily for controlling erosion, floods and maintaining sustainability of useable water yield. However, recently watershed management is not only for managing or conserving natural resources in a holistic manner, but also to involve local people for improvement of their lives. Its management is more people oriented and process based, than only physically target oriented .
Socio-economic and biophysical resource characterization helps to understand the initial livelihood condition of the people in the watershed before and after the intervention of the project to measure the amount of change attained by the project. It allows those involved in the project to understand the initial livelihood conditions and what needs to be done to reach the goal of improving the livelihoods of the community in the watershed. Biophysical resource characterization of the watershed builds necessary foundation for the plan and obtains proper information for elective and effective planning, implementation, and monitoring of the research and development endeavors particularly in the field of natural resources . The main purpose of biophysical resource characterization in the watersheds is to identify existing constraints and potential of the watershed for targeting technology transfer for sustainable development, and for enhancing productivity and sustainable development. The analysis from biophysical resource information in the watershed helps prioritize the problems with their appropriate management options and technologies which in turn leading to the implementation phase to make all the community in the watershed benefited from watershed management. However, in Gara Ebanu watershed biophysical resource characteristics was not assessed to identify major constraints, opportunities for more physical interventions and improve livelihood of the local community.
Therefore, the study was conducted to characterize, identify, prioritize, analyze, and document baseline information on biophysical resource aspects, which is used as a benchmark for planning and impact monitoring of the Gara Ebanu community watershed.
Objectives of the study
1) To characterize and document baseline information on existing biophysical resource in Gara Ebanu watershed used as benchmark for planning and impact monitoring.
2) To identify major biophysical constraints and potentials in Gara Ebanu watershed.
3) To recommend appropriate research intervention and action plans for the priority issues in the watershed.
2. Material and Methods
2.1. Description of the Study Area
2.1.1. Geographical Location
Gara Ebanu community watershed is in Sululta district of North Shewa zone of Oromia Regional State, Ethiopia. It covers an area of 670 hectare and the watershed is drain to abay basin. The study watershed is located around 5 kilometers north of chancho town and 45 kilometers north of Addis Ababa.
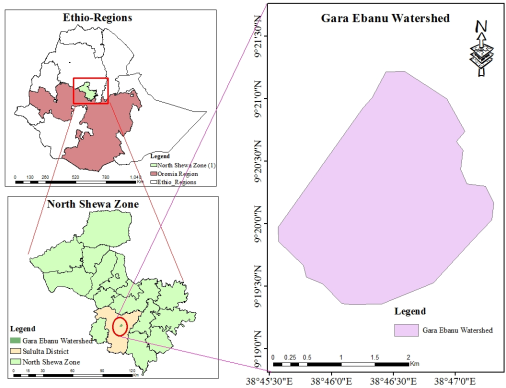
Figure 1. Map of Gara Ebanu watershed.
2.1.2. Topography and Climate
The land forms of the district are characterized by river, gorges, plateaus, mountains and plains. Thus, about 46% the area characterized by plains, 22% of the area characterized by rugged topography, 26% of the area characterized by plateaus and the remaining 6% of area characterized by mountain in the study area and the altitude varies between 1500m to 3571masl. The district exhibits three major agro-ecological conditions. These are low land (gammojji), high land (baddaa) and mid land (badda-daree) which account 3.6%, 71% and 25.4% of the district respectively. The district has an average annual rainfall of 1232mm. The mean monthly temperature varies from 6.2°C to 22°C with mean annual temperature of 15.4°C.
2.1.3. Vegetation, Soil and Land Uses
The district covered by forest as widespread from the remnant tree species dominated by Juniper procera, olea africana and podocarpus falcatus. The surrounding mountain sides were sheltered by the forest dominated by Juniperus procera tree species, and the lower part of the watershed supported stands of Acacia abyssinica, but nowadays most of the hillsides are enclosed with plantations of Eucalyptus. Remnant indigenous vegetation such as Juniper procera, Olea africana and other species have scattered distribution.
The major soil types found in the district are Cambisols, Nitosols and Vertisols, which accounts for 49%, 24.5% and 0.5% respectively. The remaining soil types made up 26 percent of the land. There are three land use systems exist in the district: cultivated lands, controlled grazing lands, and communal open grazing land.
2.1.4. Population
According to the national census report conducted in 2007, the total population of sululta district was 129,000, from this, about 64,516 were men and around 64,484 were women; 15,145 or 11.74% of its population were urban dwellers with an estimated area of 3,900 square kilometers, sululta had an estimated population density of 47.8 people per square kilometer.
2.1.5. Site Selection and Mapping of the Watershed
Prior to watershed selection, multidisciplinary research team was established for reconnaissance survey, site selection, resource characterization, planning and implementation of the watershed research. Accordingly, the established research team was selected one model watershed in the district based on agro-ecological representation, prevalence of resource management and land degradation problems and accessibility for intensive follow-up and minimizing cost. Based on the preliminary outlet identified during the watershed selection process, the watershed boundary was delineated using GPS readings. The geographical map of delineated watershed was geo-referenced and digitized for its contour, roads, rivers, and other features. The preliminary defined boundaries were verified in the field using GPS and establish reference benchmarks for future operations. Finally, elevation ranges, area of watershed, land slopes, and aspect of land related information of the watershed were extracted using the Digital Elevation Model of 30 meters resolutions. The spatial input data were projected into the same projection’s unit (UTM Zone 37N) before analysis. Map of the watershed was developed and delineated from 1:50,000 scale aerial photographs/satellite images.
2.1.6. Source of Data and Method of Data Collection
The study used a descriptive examination research design. Both qualitative and quantitative approaches were used to gather and evaluate primary and secondary data. The primary research data was collected through field observation, household survey method (questionnaires), focus group discussion and interview of the key informants. An intensive filed observation was conducted to identify detail information about biophysical and major terrain features such as topography and landforms, present land use, soils erosion status, vegetation, water resources and soil and water conservation practices in the watershed.
The household survey questionnaire was conducted to gather data about biophysical resource characteristics, plot level characteristics, and various sustainable land management (SLM) practices conducted by farmers of the study watershed. A structured interview questionnaire that involved both closed ended and open-ended questions were prepared and used to generate data from the respondents. Many spatial data were produced using a global positioning system with a positional error of ±3 m from digital elevation model and satellite images. Landsat imagery was used to generate land use land cover datasets. A maximum likelihood classifier was used in a supervised classification procedure to classify the images independently in ERDAS Imagine 15 software. To evaluate the accuracy of image classification, reference data points were used to confirm that all land use land cover classes were adequately represented based on their proportional area. The land use land cover map generated with ArcGIS environment was cross-checked and verified by field observation and knowledge of the elderly as well as Google Earth. Secondary data were gathered from published and unpublished information. The information was collected from regional, zonal and district level of agricultural and information and communication offices.
2.2. Sampling Design
Sample household farmers from the watershed were selected by using simple random sampling technique with some stratification based on watershed position considering upper, middle and lower position of watershed. The total household heads in the watershed were identified and then the representative sample was selected from the farmers living in the watershed. Accordingly, from the total 103 household heads living in the watershed, 62 household heads were selected as a respondent for the study. Key informants were selected purposely from the district agricultural experts, agricultural extension workers and watershed user cooperatives administrators. Accordingly, 3 key informants were employed. Eight knowledgeable participants were purposely selected for focus group discussion.
2.3. Data Analysis
The collected research data was managed and analyzed using Statistical Package for Social Sciences (SPSS) and Microsoft excel 2010. Descriptive tools like percentages and frequencies were presented in tables, graphs and charts.
3. Result and Discussion
3.1. General Site Information
3.1.1. Slope, Soil Fertility, Soil Color and Degree of Erosion
Table 1. Slope of land, soil fertility, soil color and degree of erosion.

Characters

Description

Plot of land

Frequency

Percent

Slope of land

Flat

72

29.4

Medium

112

45.7

Steep

61

24.9

Soil Fertility status

Low

83

33.9

Moderate

137

55.9

High

25

10.2

Soil Color

Red

132

53.9

Black

17

6.9

Gray

4

1.6

Brown

92

37.6

Degree of Soil Erosion

Slight

84

34.3

Moderate

108

44.1

Severe

46

18.8

Not recognized

7

2.9

Source: Household Survey, 2021
The characteristics of farm plots results (Table 1) showed that about 29.4% of the slope of farm plot was flat, 45.7% moderate and around 24.9% of farm plots were steep land. However, in terms of soil color, about 53.9% of farm plot soil color was red, 6.9% black, and 37.6% brown and only1.6% farm plot soil color was gray. According to farmers perception, from the total 245 cultivated farm plot owned by households, about 33.9% of farm plot had low soil fertility status, 55.9% moderate and only 10.2% of farm plot had a good soil fertility status. Also, in terms of soil erosion about 34.3% of cultivated farm plot in the study area experiences light soil erosion, 44.1% was moderate and 18.8% of cultivated farm plot experienced severe soil erosion and also about 2.9% of the respondents said that not recognize soil erosion status of the land.
3.1.2. Soil and Water Conservation Practices on Farm Sites
The results of the study summarized using descriptive analysis in Table 2 for different SWC measures practiced in each farm plot owned by households.
Table 2. Types of SWC measures practiced by farmers in the watershed.

Type of SWC practices

Frequency

Percent

Type of SWC practices

Frequency

Percent

A. Agronomic practices

B. Physical SWC practices

Mono cropping

3

5

Soil bund

8

13

Rotation (cereals – pulse)

42

68

Stone bund

7

11

Rotation (cereal-cereal)

15

24

Terrace

5

8

Rotation (cereal – others)

2

3

Cut-off drain

9

15

Home garden

8

13

Water way

31

50

Broadcasting sowing

62

100

C. Biological SWC practices

Conventional tillage practice

44

71

Using local grass

9

15

Conservation tillage practice

18

29

Road side plantation

6

10

0% crop residue left

54

87

Farm boundary plantation

9

15

50% crop residue left

8

13

Buffer stripe

1

2

D. Gully Control

Area closure (ha)

5

8

Stone Check dam

5

8

Brush wood

1

2

Others

1

2

Source: Household Survey, 2021
The result of survey (Table 2) shows that agronomic conservation practices applied were crop rotation (95%), conservational tillage practices (29%), and only 13% of sampled farmers were left fifty percent crop residue on the land in the watershed without any practice of row planting, inter cropping and double cropping. The use of proper soil management practices such as crop rotation, left crop residue, cropping systems, vegetation cover, and conservation tillage at the farm level and eventually at the watershed scale have been suggested to be among the best approaches to address severe soil erosion and low crop productivity problem .
Physical soil and water conservation measures practiced by respondents in the watershed were waterways (50%), followed by the cut-off drains (15%), soil bund (13%), stone bund (11%) and terrace (8%) of sampled farmers in the watershed. Physical conservation measures such as terraces, check dams, stone or/ and soil bunds, trenches and micro basins modify terrain through changing slope length, gradient and angle, which in turn reduce runoff velocity, enhance water infiltration and trap sediments washed down the terrain .
The biological soil and water conservation practices applied by farmers were plantation at different site (25.8%), followed by local grass strip (15%), and area closure (8%) of sampled farmers in the watershed. Others such as stone check dam (8%), brush wood and others (2%) of sampled farmers applied for gully control in the watershed.
As shown in Figure 2, farmers gave various reasons for not using structures on their farmlands., These includes, most sampled farmers (66.1%) said that no awareness about the construction of conservation structures followed by don’t have labor to construct (19.4%), the farmland is not needed conservation structure (11.3%) and lack of material for the construction of conservation structure in the watershed. The key informant interview was also conducted to get additional information. They reported that the lack of awareness about the construction of conservation structures, and the farmland is not needed conservation structure are the key reasons for respondents not using conservation structures.
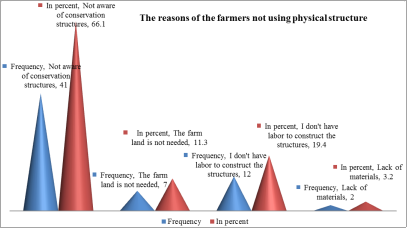
Figure 2. The reasons of farmers not using structures in their farm lands in the watershed.
Farmers’ awareness on the importance of appropriate land management and SWC practices as well as recognition that human activities and soil erosion are drivers to the current degradation is an important step towards sustainable exploitation and utilization of land resources .
3.2. Land Use Land Cover and Natural Resource in the Watershed
3.2.1. Land Use and Land Cover
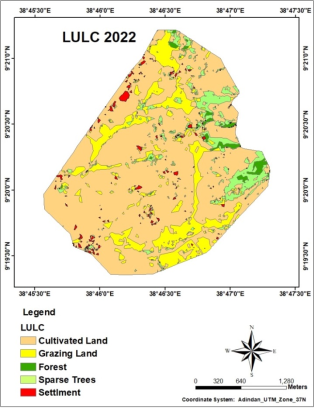
Figure 3. Land use land cover map of Gara Ebanu watershed.
Table 3. Area coverage of each land use land cover in the watershed.

Land use/ land cover

Area coverage in 2022

In (ha)

In (%)

Forest land

10.48

1.6

Cultivated land

490.87

73.2

Grazing land

111.26

16.6

Scattered tree on the farm

48.62

7.2

Settlements

9.43

1.4

Total land

670.67

100

The land-use land cover patterns of the watershed are highly dynamic, currently around 490.87 hectares are cultivated land, 111.26 ha are used for grazing land, 48.62 ha and 10.48 ha are covered by sparse trees and forest land, respectively and also 9.43 ha are used for settlements. The distribution of these land use land cover of the watershed (Table 3) indicated that, most of land (73.2%) in the watershed used for cultivated land followed by grazing land (16.6%).
3.2.2. Topography and Slope Characteristics in the Watershed
The land slope gradient (S) influences flow velocity and the rate of soil erosion. Increase in slope steepness and slope length of the land will increase soil erosion as a result of respective increases in velocity and volume of surface runoff. The effects of topography on land degradation depends on the effects of land slope steepens and slope length.
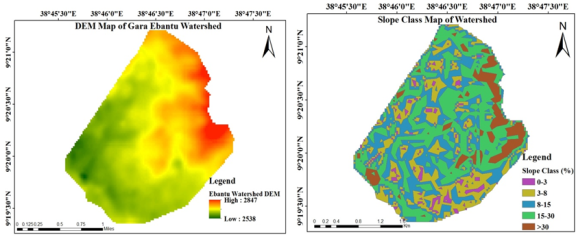
Figure 4. DEM and slope class map of Gara Ebanu watershed.
Table 4. Area coverage of each slope classes in the watershed.

Slope Class

Area (ha)

Area (%)

Flat (0-3%)

23.9

3.6

Gently Sloping (3-8%)

140.8

21.0

Moderately Steep (8-15%)

202.8

30.2

Sloping (15-30%)

242.9

36.2

Steep (>30%)

60.27

9.0

Total

670.67

100

Slope gradient of the study watersheds are classified into five classes. About 60.27 ha (9.0%) of the watershed land slope was categorized under steep slope (above 30%) and 66.4% of watershed slope classified under moderately steep to sloping slope land (8-15% and 15-30%), respectively, (Table 4). Distribution of these slope classes of watershed indicated that, 75.4% of land in the watershed classified under moderately steep to steep slope and only 3.6% of land was categorized under flat slope (0-3%). This indicate that more of the watershed landscape might be exposed to extreme flooding at time of high rain fall occurrences which implies that the need of soil and water conservation structures for sound natural resources conservation in the area. This is agreed with the findings of stating that the slope configuration provides few depositional sites within the hill slope. However, where excessive slope lengths occur, off slope transport of sediment (erosion) can be anticipated.
3.3. Soil and Water Conservation Practices in the Watershed
As observed by field observation, due to the absence of proper land management, sheet and rill erosion in most of farm lands has developed in the farm lands with neglected conservation measures and also gully formation is common along the edges of farm land boundaries, cattle tracks and roads in the watershed. According to report rill erosion is a result of surface runoff and associated sheet wash, which selectively removes fine material and organic matter that are very important determinants of land productivity. This problem might cause by destruction of forest, improper land use, high amount of annually rainfall and run off, presence of steep and uneven slopes, presence of mountains and hillside topography, no vegetation covers, cultivation of steep lands without adequate conservation measures.
The expansion and formation of gully is one of the main difficulties in degraded watersheds, it reduces the cultivable area and grazing lands, assist erosion from upstream degraded landscapes and carry a huge volume of sediment to posing a problem of siltation in downstream dams, rivers . This has significantly increased land degradation in the watershed with gullies seen in open grazing lands in the lower part of the watershed. Key informants indicated that, steep lands were increasingly being cultivated without adequate soil conservation measures. Population burden was fairly mentioned to have led to clearing of forests, bushes and depletion of natural vegetation cover to increase crop production for food needs in the families. Land fragmentation to accommodate young generation and subdivision of land has contributed to degradation of the land in the watershed, with majority of new farms increasingly being used without proper and adequate conservation measures increasingly encroaching into fragile ecosystems.
Key informants and focus groups also indicated that, steep lands were increasingly being cultivated without adequate soil conservation measures.
3.4. Vegetation Coverage in the Watershed
Vegetation coverage has excessive contribution in interception rainfall, keeping sediment loss and manages soil fertility. As the responses of sampled farmers, the major tree species found in the watershed were Juniperus procera, Olea eurpaea, Eucalyptus globulus, Acacia lahai, Ficus sur, Dodonaea angustifolia, Otostegia fruticosa, Croton macrostachyus, Podocarpus falcatus, Maesalanceolata, Carissa edulis, Maytenus senegalensis. Juniperus procera, Eucalyptus globulus and Olea eurpaea in which they were densely distributed tree species and Acacia lahai, Ficus sur and Dodonaea angustifolia dispersed tree species in the watershed. However, some of the indigenous tree species were extinct from the watershed.
Deforestation and agricultural land expansion were the major cause of extinction of native tree species such as Ekebergia capensis and Cordia Africana which are being replaced by Eucalyptus spp. The elders also said that with time and coming up of new generation they were forced to distribute part of forested land as part of land inheritance. This resulted to further clearing of hilltops, ridge summits and slope lands. Decreasing of forest and vegetation cover due to expansion of agricultural land and grazing activities has led to increase in soil erosion and depletion of soil fertility , which has negative impact on crop and livestock production, and the livelihood approaches . According to the previous study assessment reported show that universally about 13 million hectares of forest were changed to other uses or loss through natural as well as anthropogenic activities that cause reduction in forest area coverage and native species .
3.5. Identification of Major Constraints in the Watershed
Identifying of the major constraints in the watershed help to find alternative solution in tackling the constraints for the successfulness of the watershed management measures and improve the livelihood of people living in the in the watershed. Accordingly, different constraints were identified and ranked by farmers, key informants, and focus group during this baseline survey as the major constraints encountered in the watershed.
The results of the study show that the major constraints related with land and soil as identified by sampled farmers were decline of soil fertility, soil erosion, climate change, land shortage, and deforestation were major constraints significantly contributed to the low crop yield in the watershed. The results of survey (Table 5) discovered that around 27.4% of the sampled respondents had encountered decline of soil fertility problems, 25.8% of sample farmers encountered soil erosion, 22.6% of sample farmers encountered climate change and land shortage problem (16.1%) on their farms. The majority of the respondents perceived that crop production in the study area is decreasing due to low soil fertility, and soil erosion problem.
Table 5. Major constraints related to land and soil in the watershed.

Land and soil related constraints

Frequency

Percent

Decline of Soil Fertility

17

27.4

Soil Erosion

16

25.8

Climate Change

14

22.6

Land Shortage

10

16.1

Deforestation

5

8.1

Total

62

100.0

Source: Household Survey, 2021

Download: Download full-size image

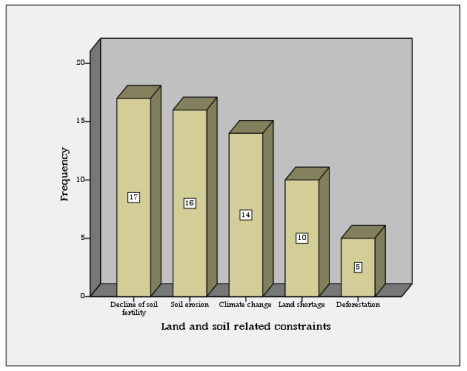
Figure 5. Graph of major constraints related to land and soil in the watershed.
3.6. Prioritization of Identified Constraints in the Watershed
Once a list of constraints was identified, the farmers, key informants and focus group ranked the overall major constraints identified as major constraints in the watershed for prioritization. Based on these methods, all participants gave rank for all identified major constraints of watershed. Then, repetition was eliminated to decrease the list to a controllable number of problems for successive ranking and planning. Accordingly, 10 major constraints were taken for pair-wise ranking method. By using pair-wise ranking method participants were asked to give a ‘1’ to the first rank, a ‘2’ to the second rank. When using pair-wise ranking, each the watershed issues were compared with all the other problems to systematically separate their comparative importance. Finally, pair-wise ranking was converted to priorities by giving a ‘1’ to the high priority and ‘0’ to the low priority (Table 6)
Table 6. Prioritized constraints in the watershed.

Decline of soil fertility

Soil erosion

Climate change

Shortage of agricultural inputs

Decline of crop productivity

Crop disease

Decline of soil fertility

0

1

1

1

1

Soil erosion

1

1

1

1

1

Climate change

0

0

0

0

1

Shortage of agricultural inputs

0

0

1

1

1

Decline of crop productivity

1

0

1

0

1

Crop disease

0

0

0

0

0

Shortage of feed and fodder

0

1

1

1

1

1

Lack of employment opportunity

0

0

1

0

0

1

Inflation

0

0

1

1

0

0

Lack of drinking water

0

0

0

0

0

0

Shortage of feed and fodder

Lack of employment opportunity

Inflation

Lack of drinking water

Score

priority

Decline of soil fertility

1

1

1

1

8

1

Soil erosion

0

1

1

1

8

1

Climate change

0

0

0

1

2

5

Shortage of agricultural inputs

0

1

0

1

5

4

Decline of crop productivity

0

1

1

1

6

3

Crop disease

0

0

1

1

2

5

Shortage of feed and fodder

0

1

1

7

2

Lack of employment opportunity

1

1

1

5

4

Inflation

0

0

0

2

5

Lack of drinking water

0

0

1

1

6

Source: Household Survey, 2021
According to the social group ranking survey result (Table 6), the highest priorities were given for decline of soil fertility, soil erosion problem, shortage of feed and fodder, and decline of crop productivity respectively. Low consideration was given for climate change, and crop disease. While, intermediate priorities were given to the high cost and shortage of agricultural inputs, and lack of employment opportunity problem.
3.7. Major Potentials/Opportunities in the Watershed
The results of major potentials/opportunities in the watershed related with natural resource, socio-economic and institution were presented in table 7.
Table 7. Major potentials in the watershed.

Potentials

Frequency

Percent

A. Natural resource potentials

Sand and coble stone

27

43.5

Permanent river

13

21.0

Forest

12

19.4

Suitable agro-ecology

10

16.1

Total

62

100.0

The result shows that, about (43.5%) of sample farmers were said that the presence of sand and coble stone followed by permanent river (21%), forest (19.4%) and suitable agro-ecology (16.1%) were the major potentials related to natural resource in the watershed.
4. Conclusion and Recommendation
Based on the result of the study it can be concluded that, there is poor level of awareness of farmers on integrated natural resource management in watershed. In the watershed, decline of soil fertility, soil erosion, deforestation, high cost of agricultural inputs, decline of crop productivity, crop disease, deficiency of animal feed and fodder, inflation, lack of employment opportunity and other income source were addressed as the highest priority issues by the community that are contributing to the crop productivity reductions and low level of their livelihood in the watershed.
Based on the aforementioned findings, the following suggestions were given for further improvement and research intervention: Attention should be given to awareness creation and strength capacity of local people on integrated natural resource management and wisely use of natural resource to overcame the problem of land degradation, deforestation, soil loss due to erosion, climate change and resource depletion which finally decreases production and productivity and increase drought & famine and to increase the awareness of peoples about the long-term benefits of soil conservation measures and plan a strategy to protect land degradation. And also, the training should be given for the community on crop production and livestock production technologies participatory degrade land rehabilitation by construction of appropriate soil and water conservation measure and planting of multi propose trees. As well as Participatory gully rehabilitation and reclamation and promotion of integrated conservation agriculture and different agronomic practices with improved crop varieties.
Generally, preparing intervention of different technologies and development plans for the identified and prioritized problem by participating communities and different potential stakeholders to solve the problems by considering the existing opportunities of the watershed.
Abbreviations

°C

Degree Centigrade

GDP

Gross Domestic Product

GPS

Global Positioning System

ha

Hectare

Km

Kilometers

km2

Square Kilometers

mm

Millimeters

SPSS

Statistical Package for Social Sciences

Acknowledgments
The authors would gratefully need to acknowledge the project of climate action through landscape management for result for financial funds of this research activity. Moreover, all staff members of Fitche Agricultural Research Center who directly or indirectly helped in data collection and other research activities are highly acknowledged.
Funding
This research was funded by World Bank for the sustainable natural resource management through integrated watershed management.
Data Availability Statement
All the data stated here are available from the authors upon request.
Conflicts of Interest
The authors declare no conflicts of interest.
References
[1] Vlek P, Bao Le Q, Tamene L (2008) Land decline in land-rich Africa: a creeping disaster in the making, pp 12–54.
[2] Desta, L.; Carucci, V.; Wendem-Ageňehu, A.; Abebe, Y. (Eds). 2005. Community based participatory watershed development: A guideline. Addis Ababa, Ethiopia: Ministry of Agriculture and Rural Development (MoARD).
[3] Pimentel, D. (2006). Soil Erosion: A Food and Environmental Threat; Journal of Environment, Development and Sustainability, 8: 119–137.
[4] Mekonen K, Tesfahunegn GB (2011) Impact assessment of soil and water conservation measures at Medego watershed in Tigray, northern Ethiopia. Maejo Int J Sci Technol 5(3): 312–330.
[5] Demelash M, Stahr K (2010) Assessment of integrated soil and water conservation measures on key soil properties in South Gonder, North-Western Highlands of Ethiopia. J Soil Sci Environ Management 1(7): 164–176.
[6] Hurni H, Abate S, Bantider A, Debele B, Ludi E, Portner B, Yitaferu B, Zeleke G (2010) Land degradation and sustainable land management in the highlands of Ethiopia. In: Hurni H, Wiesmann U (eds) with an international group of co-editors. Global change and sustainable development: a synthesis of Regional experiences from research partnerships. Perspectives of the Swiss national centre of competence in research (NCCR) North South, University of Bern, Vol. 5. Geographical Bernensia. Bern, Switzerland.
[7] Atnafe AD, Ahmed HM, Adane DM (2015) Determinants of adopting techniques of soil and water conservation in Goromti Watershed, Western Ethiopia. J Soil Science Environmental Management 6(6): 168–177.
[8] Bewket W, Teferi, E. (2009). Assessment of soil erosion hazard and prioritization for treatment at the watershed level: case study in the Chemoga watershed, Blue Nile basin, Ethiopia. Land Degradation Dev, 20, 609–622.
[9] Lemenih, M. 2004. Effects of Land use Change on Soil Quality and Native Flora Degradation and Restoration in the Highlands of Ethiopia. Implication for Sustainable Land Management. Swedish University of Agricultural Science. Uppsala, Sweden.
[10] Gebremedhin Yihdego (2004). Community Participation and Sustainable Soil and Water Conservation Management. The Case of Zala-Daget Project: Dogu’a Tembien WoredaTigray Highlands. Unpublished Master Thesis, Addis Ababa University, School of Graduate Studies, Addis Ababa.
[11] Gebregziabher, G., Abera, D. A., Gebresamuel, G., Giordano, M. & Langan, S. (2016). An assessment of integrated watershed management in Ethiopia (Vol. 170). International Water Management Institute (IWMI).
[12] Bonsa Fentale Jilo, Gemeda Terfassa Fida, Desta Negayo Komicho. (2020) Socio-economic and Biophysical Resources Characterization of ‘Warja’ Watershed in Adami Tulu Jido Kombolcha District, East Shewa Zone, Oromia, Ethiopia.
[13] Bekele A (2006). Participatory watershed management: Lessons from RELMA‟s work with f armers in eastern Africa. ICRAF Working, P. 22.
[14] Schmidt, E. and Tadesse, F (2012). Household and Plot Level Impact of Sustainable Land and Watershed Management (SLWM) Practices in the Blue Nile. Ethiopia Strategy Support Program II (ESSP II) ESSP II Working Paper 42, Ethiopia, August.
[15] Tesfaye A, Githiri M, Derera J, Debele T (2011). Subsistence f armers‟ experience and perception about the soil, and fertilizer use in Western Ethiopia. Ethiop J ApplSciTechnol, 2: 61-74.
[16] Geta E, Bogale A, Kassa B, Elias E, (2013). Determinants of Farmers‟ Decision on Soil Fertility Management Options for Maize Production in Southern Ethiopia. Am J Experimental Agric, 3: 226-239.
[17] Vancampenhout K, Nyssen J, Gebremichael D, Deckers J, Poesen J, Haile M (2006). Stone bunds for soil conservation in the northern Ethiopian highlands: impacts on soil fertility and crop yield. Soil Tillage Res, 90: 1-15.
[18] Tesfaye A, Negatu W, Brouwer R, van der Zaag P (2014). Understanding soil conservation decision of farmers in the gedeb watershed, Ethiopia. Land DegradDev 25: 71-79.
[19] Betteridge, K., Mackay, A. D., Shepherd T. G., Barker D. J., Budding P. J., Devantier B. P., & Costall D. A. (1999). Effect of cattle and sheep treading on surface configuration of a sedimentary hill soil. Soil Research, 37(4), pp. 743-760.
[20] Bewket, W. and G. Sterk, (2003). Assessment of soil erosion in cultivated fields using a survey methodology for rills in the Chemoga watershed, Ethiopia, Agr. Ecosyst. Environ., 97: 81-93.
[21] Muia VK, Ndunda E (2013). Evaluating the impact of direct anthropogenic activities on land degradation in arid and semi-arid regions in Kenya.
[22] Ifejika SC, Kiteme B, Wisemann U (2008). Droughts and famine, the underlying factors and causal links among agro-pastoral households in semi-arid Makueni District, Kenya. Glob Environ Chang 18: 220-233.
[23] FAO, (2010c). Global Forest Resources Assessment 2010 key findings, Rome.
Cite This Article
  • APA Style

    Bedada, E., Mengistu, B., Muluna, M., Tolosa, M., Jifara, M., et al. (2024). Biophysical Resource Characterization, Identification and Prioritization of Major Constraints and Potentials of Gara Ebanu Community Watershed in Sululta District, Ethiopia. Agriculture, Forestry and Fisheries, 13(4), 94-105. https://doi.org/10.11648/j.aff.20241304.11

    Copy | Download

    ACS Style

    Bedada, E.; Mengistu, B.; Muluna, M.; Tolosa, M.; Jifara, M., et al. Biophysical Resource Characterization, Identification and Prioritization of Major Constraints and Potentials of Gara Ebanu Community Watershed in Sululta District, Ethiopia. Agric. For. Fish. 2024, 13(4), 94-105. doi: 10.11648/j.aff.20241304.11

    Copy | Download

    AMA Style

    Bedada E, Mengistu B, Muluna M, Tolosa M, Jifara M, et al. Biophysical Resource Characterization, Identification and Prioritization of Major Constraints and Potentials of Gara Ebanu Community Watershed in Sululta District, Ethiopia. Agric For Fish. 2024;13(4):94-105. doi: 10.11648/j.aff.20241304.11

    Copy | Download

  • @article{10.11648/j.aff.20241304.11,
      author = {Endale Bedada and Bikila Mengistu and Meseret Muluna and Meron Tolosa and Mengistu Jifara and Alemayehu Biri and Firaol Legesse and Ajema Lemma and Bedo Hora and Lemma Teklu and Woubalem Abera},
      title = {Biophysical Resource Characterization, Identification and Prioritization of Major Constraints and Potentials of Gara Ebanu Community Watershed in Sululta District, Ethiopia
    },
      journal = {Agriculture, Forestry and Fisheries},
      volume = {13},
      number = {4},
      pages = {94-105},
      doi = {10.11648/j.aff.20241304.11},
      url = {https://doi.org/10.11648/j.aff.20241304.11},
      eprint = {https://article.sciencepublishinggroup.com/pdf/10.11648.j.aff.20241304.11},
      abstract = {Baseline characterization helps to understand the initial livelihood condition of the people in the watershed before and after the intervention of the project to measure the amount of change attained by the project. The objective of the study was to characterize baseline information on the existing biophysical resource used as benchmark for planning and impact monitoring and to identify and major constraints and potential in the watershed. The watershed was selected depending on agro-ecological representation, prevalence of resource management and land degradation problems and accessibility for intensive follow-up. Based on the preliminary outlet identified during the watershed selection process, the watershed boundary was delineated using GPS data and the map of watershed was geo-referenced and digitized for its contour, roads, rivers, and other features. Both primary and secondary data were used for the study and primary data was collected through field observation, household survey, focus group discussion and interview of the key informants. From the total 103 household heads living in the watershed, 62 household heads were selected as a respondent for the study. The collected data was managed and analyzed using Statistical Package for Social Sciences (SPSS) and Microsoft excel 2010. The results of the study showed that about 29.4% of the watershed slope was characterized by flat lands, 45.7% moderate slope and 24.9% steep lands. As well as soil fertility status of cultivated land in the watershed were 33.9% low, 55.9% moderate and 10.2% high. The results of the study showed that the major constraints identified by sampled household heads were decline of soil fertility, soil erosion, climate change, land shortage, and deforestation were significantly contributed to the low crop yield in the watershed. About 27.4% of the sampled households had encountered decline of soil fertility problems, 25.8% of sample farmers encountered soil erosion problem, and 22.6% of sample farmers encountered climate change problem in the watershed. From the identified major constraints, the highest priorities were given for decline of soil fertility, soil erosion problem, shortage of feed and fodder, and decline of crop productivity respectively. In the watershed, immediate short-term actions should be taken particularly participatory integrated watershed management were recommended.
    },
     year = {2024}
    }
    

    Copy | Download

  • TY  - JOUR
    T1  - Biophysical Resource Characterization, Identification and Prioritization of Major Constraints and Potentials of Gara Ebanu Community Watershed in Sululta District, Ethiopia
    
    AU  - Endale Bedada
    AU  - Bikila Mengistu
    AU  - Meseret Muluna
    AU  - Meron Tolosa
    AU  - Mengistu Jifara
    AU  - Alemayehu Biri
    AU  - Firaol Legesse
    AU  - Ajema Lemma
    AU  - Bedo Hora
    AU  - Lemma Teklu
    AU  - Woubalem Abera
    Y1  - 2024/07/15
    PY  - 2024
    N1  - https://doi.org/10.11648/j.aff.20241304.11
    DO  - 10.11648/j.aff.20241304.11
    T2  - Agriculture, Forestry and Fisheries
    JF  - Agriculture, Forestry and Fisheries
    JO  - Agriculture, Forestry and Fisheries
    SP  - 94
    EP  - 105
    PB  - Science Publishing Group
    SN  - 2328-5648
    UR  - https://doi.org/10.11648/j.aff.20241304.11
    AB  - Baseline characterization helps to understand the initial livelihood condition of the people in the watershed before and after the intervention of the project to measure the amount of change attained by the project. The objective of the study was to characterize baseline information on the existing biophysical resource used as benchmark for planning and impact monitoring and to identify and major constraints and potential in the watershed. The watershed was selected depending on agro-ecological representation, prevalence of resource management and land degradation problems and accessibility for intensive follow-up. Based on the preliminary outlet identified during the watershed selection process, the watershed boundary was delineated using GPS data and the map of watershed was geo-referenced and digitized for its contour, roads, rivers, and other features. Both primary and secondary data were used for the study and primary data was collected through field observation, household survey, focus group discussion and interview of the key informants. From the total 103 household heads living in the watershed, 62 household heads were selected as a respondent for the study. The collected data was managed and analyzed using Statistical Package for Social Sciences (SPSS) and Microsoft excel 2010. The results of the study showed that about 29.4% of the watershed slope was characterized by flat lands, 45.7% moderate slope and 24.9% steep lands. As well as soil fertility status of cultivated land in the watershed were 33.9% low, 55.9% moderate and 10.2% high. The results of the study showed that the major constraints identified by sampled household heads were decline of soil fertility, soil erosion, climate change, land shortage, and deforestation were significantly contributed to the low crop yield in the watershed. About 27.4% of the sampled households had encountered decline of soil fertility problems, 25.8% of sample farmers encountered soil erosion problem, and 22.6% of sample farmers encountered climate change problem in the watershed. From the identified major constraints, the highest priorities were given for decline of soil fertility, soil erosion problem, shortage of feed and fodder, and decline of crop productivity respectively. In the watershed, immediate short-term actions should be taken particularly participatory integrated watershed management were recommended.
    
    VL  - 13
    IS  - 4
    ER  - 

    Copy | Download

Author Information
  • Oromia Agricultural Research Institute, Fitche Agricultural Research Center, Fitche, Ethiopia

  • Oromia Agricultural Research Institute, Fitche Agricultural Research Center, Fitche, Ethiopia

  • Oromia Agricultural Research Institute, Fitche Agricultural Research Center, Fitche, Ethiopia

  • Oromia Agricultural Research Institute, Fitche Agricultural Research Center, Fitche, Ethiopia

  • Oromia Agricultural Research Institute, Fitche Agricultural Research Center, Fitche, Ethiopia

  • Oromia Agricultural Research Institute, Fitche Agricultural Research Center, Fitche, Ethiopia

  • Oromia Agricultural Research Institute, Fitche Agricultural Research Center, Fitche, Ethiopia

  • Oromia Agricultural Research Institute, Fitche Agricultural Research Center, Fitche, Ethiopia

  • Oromia Agricultural Research Institute, Fitche Agricultural Research Center, Fitche, Ethiopia

  • Oromia Agricultural Research Institute, Fitche Agricultural Research Center, Fitche, Ethiopia

  • Oromia Agricultural Research Institute, Fitche Agricultural Research Center, Fitche, Ethiopia

  • Abstract
  • Keywords
  • Document Sections

    1. 1. Introduction
    2. 2. Material and Methods
    3. 3. Result and Discussion
    4. 4. Conclusion and Recommendation
    Show Full Outline
  • Abbreviations
  • Acknowledgments
  • Funding
  • Data Availability Statement
  • Conflicts of Interest
  • References
  • Cite This Article
  • Author Information