Soybean soapstock (SS), a lipid rich by-product of soybean oil production is a promising feedstock for the production ofbiodiesel due to its availability and affordability. In the esterification and transesterification reactions involving soyabeansoapstock, sodium hydroxide, methanol and n-hexane were used as catalyst, solvent and co-solvent respectively. The physico-chemical properties of the biodiesel obtained were determinedusing the Association of Analytical Chemist (AOAC) and American Society of Testing Materials (ASTM) methods. The esterification and transesterification reactions were optimised using both response surface methodology (RSM) under design expert 7.0 platform and Particle swarm technique in ANFIS (ANFIS-PSO) using the MATLAB software. The optimized acid value from the esterification reaction using RSM and ANFIS-PSO were 4.956 and 1.488 while the yield obtained were 97.29% and 99.91%respectively with ANFIS-PSO proving to be the better optimization technique in both cases. Comparison plots made for both reactions shows the ANFIS-PSO curve mirroring the experimental and thus signifying a closer trend when compared to the RSM curve. The suitability of the ANFIS-PSO prediction was further highlighted by the error analysis carried out on both techniques. The Residual sum of squares (RSS), Mean absolute error (MAE), Root mean square error (RMSE), Correlation coefficient (R), Coefficient of determination (R2), Adjusted R2, Absolute average deviation (AAD) and Mean absolute percent error (MAPE) values for the ANFIS-PSO predictions in both reactions were better than the RSM predictions. It can thus be concluded that soybean soapstock is a viable feedstock for biodiesel production and ANFIS-PSO is a more efficient optimization technique when compared with RSM in esterification and transesterification of soybean soapstock.
| Published in | Advances (Volume 5, Issue 2) |
| DOI | 10.11648/j.advances.20240502.13 |
| Page(s) | 49-63 |
| Creative Commons |
This is an Open Access article, distributed under the terms of the Creative Commons Attribution 4.0 International License (http://creativecommons.org/licenses/by/4.0/), which permits unrestricted use, distribution and reproduction in any medium or format, provided the original work is properly cited. |
| Copyright |
Copyright © The Author(s), 2024. Published by Science Publishing Group |
Biodiesel, Soyabean Soapstock, Response Surface Methodology (RSM), Adaptive Neuro-Fuzzy Inference System (ANFIS), Particle Swarm Optimization (PSO)
Variables/Unit | Symbols | Coded | levels | |||
|---|---|---|---|---|---|---|
-2 | -1 | 0 | +1 | +2 | ||
Catalyst concentration (wt%) | A | 5 | 10 | 15 | 20 | 25 |
Methanol/FFA volume ratio | B | 2:1 | 4:1 | 6:1 | 8:1 | 10:1 |
Temperature (°C) | C | 55 | 60 | 65 | 70 | 75 |
Esterification time (min) | D | 60 | 70 | 80 | 90 | 100 |
Independent variables | Symbols | Coded | variables | Levels | ||
|---|---|---|---|---|---|---|
-ɑ | -1 | 0 | +1 | +ɑ | ||
Temperature (°C) | X1 | 45 | 50 | 55 | 60 | 65 |
Reaction time (min) | X2 | 45 | 50 | 55 | 60 | 65 |
Catalyst concentration (wt %) | X3 | 0.50 | 1.00 | 1.50 | 2.00 | 2.50 |
Methanol/oil ratio (mol/mol) | X4 | 3:1 | 4:1 | 5:1 | 6:1 | 7:1 |
Stiring speed (rpm) | X5 | 200 | 300 | 400 | 500 | 600 |
Run | Catalyst. Concentration. (wt%) | Methanol/oil ratio (mol/mol) | Temperature | Time (min) | Acid Value | Rsm Prediction |
|---|---|---|---|---|---|---|
1 | 1.5 | 2 | 70 | 90 | 5.67 | 5.76 |
2 | 1.5 | 2 | 65 | 80 | 6.03 | 5.25 |
3 | 2 | 1.5 | 65 | 80 | 5.18 | 6.6 |
4 | 1.5 | 1.5 | 65 | 70 | 5.04 | 5.49 |
5 | 1.5 | 2 | 65 | 80 | 6.54 | 5.86 |
6 | 1.5 | 2 | 60 | 90 | 4.99 | 5.98 |
7 | 1.5 | 2 | 60 | 70 | 5.98 | 5.32 |
8 | 2 | 2 | 65 | 70 | 6.06 | 5.97 |
9 | 2 | 2 | 70 | 80 | 5.76 | 6.78 |
10 | 2 | 2 | 60 | 80 | 5.25 | 6.15 |
11 | 1.5 | 2.5 | 65 | 90 | 5.35 | 6.68 |
12 | 1.5 | 2 | 70 | 70 | 6.12 | 5.69 |
13 | 1 | 2 | 65 | 90 | 7.01 | 4.83 |
14 | 1.5 | 1.5 | 70 | 80 | 5.25 | 5.25 |
15 | 2 | 2.5 | 65 | 80 | 5.26 | 5.09 |
16 | 1.5 | 1.5 | 65 | 90 | 5.3 | 5.76 |
17 | 1.5 | 2.5 | 70 | 80 | 5.87 | 6.28 |
18 | 1 | 1.5 | 65 | 80 | 5.8 | 5.3 |
19 | 1.5 | 1.5 | 60 | 80 | 4.96 | 6.5 |
20 | 1.5 | 2 | 65 | 80 | 5.24 | 5.86 |
21 | 1 | 2 | 60 | 80 | 6.32 | 5.09 |
22 | 1.5 | 2 | 65 | 80 | 5.23 | 6.33 |
23 | 2 | 2 | 65 | 90 | 6.22 | 5.51 |
24 | 1.5 | 2.5 | 60 | 80 | 5.33 | 5.36 |
25 | 1 | 2 | 70 | 80 | 6.48 | 5.91 |
26 | 1 | 2.5 | 65 | 80 | 6.48 | 5.91 |
27 | 1.5 | 2.5 | 65 | 70 | 6.48 | 5.91 |
28 | 1 | 2 | 65 | 70 | 6.48 | 5.91 |
29 | 1.5 | 2 | 65 | 80 | 6.48 | 5.91 |
Source | Sum of squares | Df | Mean square | F value | p-value Prob> F | |
|---|---|---|---|---|---|---|
Model | 7.05 | 14 | 0.5 | 2.73 | 0.0014 | significant |
A-Catalyst Conc (wt%) | 1.97 | 1 | 1.97 | 10.67 | 0.0056 | |
B-Methanol/oil ratio (mol/mol) | 0.88 | 1 | 0.88 | 4.78 | 0.0463 | |
C-Temp (°C) | 0.45 | 1 | 0.45 | 2.45 | 0.0397 | |
D-Time (min) | 0.22 | 1 | 0.22 | 1.21 | 0.2894 | |
AB | 0.092 | 1 | 0.092 | 0.5 | 0.0011 | |
AC | 0.029 | 1 | 0.029 | 0.16 | 0.6968 | |
AD | 0.033 | 1 | 0.033 | 0.18 | 0.6801 | |
BC | 0.016 | 1 | 0.016 | 0.085 | 0.7755 | |
BD | 0.49 | 1 | 0.49 | 2.64 | 0.0023 | |
CD | 0.072 | 1 | 0.072 | 0.39 | 0.543 | |
A^2 | 0.62 | 1 | 0.62 | 3.36 | 0.008 | |
B^2 | 1.26 | 1 | 1.26 | 6.84 | 0.0204 | |
C^2 | 0.35 | 1 | 0.35 | 1.89 | 0.191 | |
D^2 | 0.077 | 1 | 0.077 | 0.42 | 0.5288 | |
Residual | 2.59 | 14 | 0.18 | |||
Lack of Fit | 0.93 | 10 | 0.093 | 0.22 | 0.9747 | not significant |
Pure Error | 1.66 | 4 | 0.41 | |||
Cor Total | 9.64 | 28 |
Std. Dev. | 5.43 | R-Squared | 0.9316 |
|---|---|---|---|
Mean | 5.8 | Adj R-Squared | 0.9131 |
C.V. % | 7.41 | Pred R-Squared | 0.8752 |
PRESS | 117.95 | Adeq Precision | 6.296 |
Run | Time (min) | Temperature (°C) | Catalyst concentration (wt%) | Methanol/oil ratio (mol/mol) | Stirring speed (rpm) | Yield (%) | Rsm Prediction (%) |
|---|---|---|---|---|---|---|---|
1 | 50 | 50 | 2 | 5 | 400 | 90.9 | 93.98 |
2 | 50 | 50 | 2 | 7 | 400 | 90.48 | 87.98 |
3 | 50 | 50 | 3 | 5 | 400 | 91.88 | 86.48 |
4 | 50 | 50 | 2 | 5 | 400 | 92.98 | 87.78 |
5 | 65 | 45 | 2.5 | 4 | 500 | 77.88 | 74.88 |
6 | 50 | 45 | 2.5 | 4 | 300 | 93.08 | 97.58 |
7 | 65 | 55 | 2.5 | 6 | 500 | 77.48 | 75.08 |
8 | 50 | 45 | 2.5 | 6 | 500 | 93.18 | 95.38 |
9 | 50 | 45 | 1.5 | 6 | 300 | 79.38 | 77.48 |
10 | 50 | 55 | 2.5 | 6 | 300 | 79.38 | 89.48 |
11 | 50 | 50 | 2 | 5 | 400 | 93.78 | 97.48 |
12 | 50 | 50 | 2 | 5 | 400 | 91.28 | 95.18 |
13 | 65 | 55 | 2.5 | 4 | 300 | 93.98 | 93.08 |
14 | 45 | 50 | 2 | 5 | 400 | 78.88 | 79.38 |
15 | 65 | 55 | 1.5 | 4 | 500 | 95.08 | 97.38 |
16 | 50 | 50 | 2 | 5 | 400 | 95.48 | 93.48 |
17 | 50 | 50 | 2 | 5 | 600 | 95.38 | 97.48 |
18 | 50 | 50 | 2 | 5 | 400 | 95.18 | 97.48 |
19 | 50 | 50 | 1 | 5 | 400 | 79.48 | 85.08 |
20 | 50 | 55 | 1.5 | 4 | 300 | 96.8 | 95.88 |
21 | 65 | 45 | 2.5 | 6 | 300 | 77.98 | 79.9 |
22 | 50 | 55 | 1.5 | 6 | 500 | 78.48 | 81.28 |
23 | 65 | 45 | 1.5 | 6 | 500 | 77.58 | 73.58 |
24 | 50 | 60 | 2 | 5 | 400 | 78.48 | 75.78 |
25 | 50 | 50 | 2 | 5 | 200 | 93.98 | 94.98 |
26 | 50 | 55 | 2.5 | 4 | 500 | 93.58 | 93.98 |
27 | 50 | 45 | 1.5 | 4 | 300 | 79.48 | 83.18 |
28 | 50 | 50 | 2 | 3 | 400 | 93.08 | 95.88 |
29 | 65 | 55 | 1.5 | 6 | 300 | 76.48 | 79.48 |
30 | 50 | 55 | 1.5 | 5 | 400 | 77.78 | 78.88 |
31 | 50 | 45 | 2 | 5 | 400 | 94.98 | 92.98 |
32 | 55 | 45 | 2.5 | 4 | 500 | 78.88 | 86.8 |
Source | Sum of Squares | Df | Mean Square | F Value | p-value Prob> F | |
|---|---|---|---|---|---|---|
Model | 1627.63 | 20 | 81.38 | 3.49 | 0.0086 | significant |
A-Rxn Time (min) | 144.16 | 1 | 144.16 | 6.19 | 0.0302 | |
B-Rxn Temp (°C) | 94.17 | 1 | 94.17 | 4.04 | 0.0695 | |
C-Cat Conc.(wt%) | 128.23 | 1 | 128.23 | 5.5 | 0.0088 | |
D-Methanol/oil mol ratio (mol/mol) | 381.23 | 1 | 381.23 | 16.36 | 0.0019 | |
E-Stirring speed (rpm) | 0.014 | 1 | 0.014 | 6.19E-04 | 0.9806 | |
AB | 8.95 | 1 | 8.95 | 0.38 | 0.548 | |
AC | 58.55 | 1 | 58.55 | 2.51 | 0.0012 | |
AD | 29.9 | 1 | 29.9 | 1.28 | 0.0013 | |
AE | 0.69 | 1 | 0.69 | 0.029 | 0.8668 | |
BC | 16.62 | 1 | 16.62 | 0.71 | 0.4163 | |
BD | 241.37 | 1 | 241.37 | 10.36 | 0.0082 | |
BE | 10.16 | 1 | 10.16 | 0.44 | 0.0025 | |
CD | 6.27 | 1 | 6.27 | 0.27 | 0.6143 | |
CE | 0.48 | 1 | 0.48 | 0.021 | 0.8881 | |
DE | 79.74 | 1 | 79.74 | 3.42 | 0.0913 | |
A^2 | 146.35 | 1 | 146.35 | 6.28 | 0.0022 | |
B^2 | 243.35 | 1 | 243.35 | 10.45 | 0.008 | |
C^2 | 142.4 | 1 | 142.4 | 6.11 | 0.0015 | |
D^2 | 9.18 | 1 | 9.18 | 0.39 | 0.5431 | |
E^2 | 0.53 | 1 | 0.53 | 0.023 | 0.8823 | |
Residual | 256.28 | 11 | 23.3 | |||
Lack of Fit | 237.83 | 6 | 39.64 | 8.74 | 3.099 | Not- significant |
Pure Error | 18.45 | 5 | 3.69 | |||
Cor Total | 1883.91 | 31 |
Std. Dev. | 4.83 | R-Squared | 0.964 |
|---|---|---|---|
Mean | 86.96 | AdjR-Squared | 0.9466 |
C.V. % | 5.55 | Pred R-Squared | 0.9004 |
PRESS | 420.9 | Adeq Precision | 5.474 |
Runs | Catalyst concentration (wt%) | Methanol/oil ratio (mol/mol) | Temperature (°C) | Time (min) | Acid Value | ANFIS prediction |
|---|---|---|---|---|---|---|
1 | 1.5 | 2 | 70 | 90 | 5.67 | 5.67 |
2 | 1.5 | 2 | 65 | 80 | 6.03 | 5.904 |
3 | 2 | 1.5 | 65 | 80 | 5.18 | 5.18 |
4 | 1.5 | 1.5 | 65 | 70 | 5.04 | 5.04 |
5 | 1.5 | 2 | 65 | 80 | 6.54 | 5.904 |
6 | 1.5 | 2 | 60 | 90 | 4.99 | 4.99 |
7 | 1.5 | 2 | 60 | 70 | 5.98 | 5.98 |
8 | 2 | 2 | 65 | 70 | 6.06 | 6.06 |
9 | 2 | 2 | 70 | 80 | 5.76 | 5.76 |
10 | 2 | 2 | 60 | 80 | 5.25 | 5.25 |
11 | 1.5 | 2.5 | 65 | 90 | 5.35 | 5.35 |
12 | 1.5 | 2 | 70 | 70 | 6.12 | 6.12 |
13 | 1 | 2 | 65 | 90 | 7.01 | 7.01 |
14 | 1.5 | 1.5 | 70 | 80 | 5.25 | 5.25 |
15 | 2 | 2.5 | 65 | 80 | 5.26 | 5.26 |
16 | 1.5 | 1.5 | 65 | 90 | 5.3 | 5.3 |
17 | 1.5 | 2.5 | 70 | 80 | 5.87 | 5.87 |
18 | 1 | 1.5 | 65 | 80 | 5.8 | 5.8 |
19 | 1.5 | 1.5 | 60 | 80 | 4.96 | 4.96 |
20 | 1.5 | 2 | 65 | 80 | 5.24 | 5.904 |
21 | 1 | 2 | 60 | 80 | 6.32 | 6.32 |
22 | 1.5 | 2 | 65 | 80 | 5.23 | 5.904 |
23 | 2 | 2 | 65 | 90 | 6.22 | 6.22 |
24 | 1.5 | 2.5 | 60 | 80 | 5.33 | 5.33 |
25 | 1 | 2 | 70 | 80 | 6.48 | 6.48 |
26 | 1 | 2.5 | 65 | 80 | 6.48 | 6.48 |
27 | 1.5 | 2.5 | 65 | 70 | 6.48 | 6.48 |
28 | 1 | 2 | 65 | 70 | 6.48 | 6.48 |
29 | 1.5 | 2 | 65 | 80 | 6.48 | 5.904 |
Run | Reaction Time (min) | Temperature (°C) | Catalyst Concentration (wt%) | Methanol/Oil ratio (mol/mol) | Stirring speed (rpm) | Yield | ANFIS prediction |
|---|---|---|---|---|---|---|---|
1 | 50 | 50 | 2 | 5 | 400 | 90.9 | 93.27 |
2 | 50 | 50 | 2 | 7 | 400 | 90.48 | 90.48 |
3 | 50 | 50 | 3 | 5 | 400 | 91.88 | 91.88 |
4 | 50 | 50 | 2 | 5 | 400 | 92.98 | 93.27 |
5 | 65 | 45 | 2.5 | 4 | 500 | 77.88 | 77.88 |
6 | 50 | 45 | 2.5 | 4 | 300 | 93.08 | 93.08 |
7 | 65 | 55 | 2.5 | 6 | 500 | 77.48 | 77.48 |
8 | 50 | 45 | 2.5 | 6 | 500 | 93.18 | 93.18 |
9 | 50 | 45 | 1.5 | 6 | 300 | 79.38 | 79.38 |
10 | 50 | 55 | 2.5 | 6 | 300 | 79.38 | 79.38 |
11 | 50 | 50 | 2 | 5 | 400 | 93.78 | 93.27 |
12 | 50 | 50 | 2 | 5 | 400 | 91.28 | 93.27 |
13 | 65 | 55 | 2.5 | 4 | 300 | 93.98 | 93.98 |
14 | 45 | 50 | 2 | 5 | 400 | 78.88 | 78.88 |
15 | 65 | 55 | 1.5 | 4 | 500 | 95.08 | 95.08 |
16 | 50 | 50 | 2 | 5 | 400 | 95.48 | 93.27 |
17 | 50 | 50 | 2 | 5 | 600 | 95.38 | 95.38 |
18 | 50 | 50 | 2 | 5 | 400 | 95.18 | 93.27 |
19 | 50 | 50 | 1 | 5 | 400 | 79.48 | 79.48 |
20 | 50 | 55 | 1.5 | 4 | 300 | 96.8 | 96.8 |
21 | 65 | 45 | 2.5 | 6 | 300 | 77.98 | 77.98 |
22 | 50 | 55 | 1.5 | 6 | 500 | 78.48 | 78.48 |
23 | 65 | 45 | 1.5 | 6 | 500 | 77.58 | 77.58 |
24 | 50 | 60 | 2 | 5 | 400 | 78.48 | 78.48 |
25 | 50 | 50 | 2 | 5 | 200 | 93.98 | 93.98 |
26 | 50 | 55 | 2.5 | 4 | 500 | 93.58 | 93.58 |
27 | 50 | 45 | 1.5 | 4 | 300 | 79.48 | 79.48 |
28 | 50 | 50 | 2 | 3 | 400 | 93.08 | 93.08 |
29 | 65 | 55 | 1.5 | 6 | 300 | 76.48 | 76.48 |
30 | 50 | 55 | 1.5 | 5 | 400 | 77.78 | 77.78 |
31 | 50 | 45 | 2 | 5 | 400 | 94.98 | 94.98 |
32 | 55 | 45 | 2.5 | 4 | 500 | 78.88 | 78.88 |
Parameter | RSM | ANFIS |
|---|---|---|
Temperature | 61.63 | 60 |
Time | 74.01 | 73 |
Catalyst concentration | 1.77 | 1.5 |
Methanol/oil ratio | 1.52 | 1.5 |
Acid value | 4.956 | 1.488 |
Parameter | RSM | ANFIS |
|---|---|---|
Temperature | 50.68 | 54 |
Time | 53.36 | 42 |
Catalyst concentration | 1.77 | 1.5 |
Methanol/Oil ratio | 4.36 | 4 |
Speed | 407.6 | 300 |
Yield | 97.29 | 99.91 |
Erroranalysismethod | Esterification of soya soapstock | Transesterification of soya soapstock | ||
|---|---|---|---|---|
ANFIS | RSM | ANFIS | RSM | |
RSS | 1.647 | 21.545 | 18.453 | 433 |
MAE | 0.092 | 0.711 | 0.29 | 3.057 |
RSME | 0.238 | 0.862 | 0.759 | 3.678 |
R | 0.909 | 0.298 | 0.995 | 0.899 |
R2 | 0.828 | 0.089 | 0.99 | 0.81 |
ADJ R2 | 0.821 | 0.044 | 0.989 | 0.804 |
AAD | 6.13E-17 | 0.0027 | 0.00045 | -1 |
MAPE | 1.595 | 12.355 | 0.312 | 3.596 |
RSM | Response Surface Methodology |
ANFIS | Adaptive Neuro-Fuzzy Inference System |
RSS | Residual Sum of Squares |
MAE | Mean Absolute Error |
RMSE | Root Mean Square Error |
R | Coerrelation Coefficient |
R2 | Coefficient of Determination |
AAD | Absolute Average Deviation |
MAPE | Mean Absolute Percent Error |
| [1] | Akintola, K. G, Ojokoh, B. A. and Daramola, O. A. (2013). A hybrid computational model forevaluating applicants credentials. A study submitted to the department of computerScience, Federal University of Technology, Akure. |
| [2] | Awolu, O. O. and Layokun, S. K. (2013). Optimisation of two-step tranesterificationproductionof biodiesel from neem (Azadirachtaindica) oil. Int J. of Energy and EnvironmentalEngineering, 4, 39-48. |
| [3] | Bezerra, M., Santelli, R., Oliveira, E., Villar, L., &Escaleira, L (2008). Response Surface Methodology (RSM) as a Tool for Optimization in Analytical Chemistry. Talanta. 76. 965-977. |
| [4] | Chinedu Gabriel Mbah, Chizoo Victor Esonye, Dominic OkechukwuOnukwuli. Kinetics of Biodiesel Production from Soya Bean Soap Stock. Earth Sciences. Vol. 10, No. 5, 2021, pp. 198-206. |
| [5] | Chinedu Gabriel Mbah, Chizoo Victor Esonye, Dominic OkechukwuOnukwuli, Victor ChukwuemekaEze. Use of response surface methodology (RSM) in optimization of biodiesel production from cow tallow. International journal of innovations in engineering research and technology. Vol. 8, No. 8, 2021, pp. 91-102. |
| [6] | Fu, Y. J. Zu. Y. G., Wang. L, Zhang, N. J, Liu. W, Li, S. M. and Zhang, S. (2008). Determination of fatty acid methyl esters in biodiesel produced from yellow corn oil byRP-LC-RID. Chromatographia, 67, 9-14. |
| [7] | Khalil, J., Rashid, A., Aziz, A., Yusup, S., Heikal, M & El-Adawry, M. (2016) Response surfacemethodology for the optimization of the production of rubber seed/palm oil biodiesel, IDI diesel engineperformance, and emissions. Biomass Conv. Bioref. 10(10): pp 221. |
| [8] | Moghaddamnia, A, Ghafari, M, Piri, J, Amin, S and Han, D (2009). Evaporation estimationusing artificial neural networks and adaptive neuro-fuzzy inference system technique. Adv Water Resour 32(1), 88–97. |
| [9] | Moradi, S and Rafiei, F. M (2019). A dynamic credit risk assessment model with data minningtechniques: evidence from Iranian banks. Financial innovation, 5(15), 2-10. |
| [10] | Oyedepo, S. O. (2012). Energy and sustainable development in Nigeria: the way forward. EnergySustainSoc, 2(15). |
| [11] | Toldra-Reig, F, Mora, L and Toldra, F. (2020). Trends in biodiesel production from animal fatwaste. MDPI, 10(10), 36-44. |
APA Style
Mbah, C. G., Nwafulugo, F. U., Ezetoha, N. O. (2024). Comparism of Response Surface Methodology (RSM) and Adaptive Neuro-Fuzzy Inference Systems (ANFIS) in Optimisation of Soybean Soapstock Biodiesel Production. Advances, 5(2), 49-63. https://doi.org/10.11648/j.advances.20240502.13
ACS Style
Mbah, C. G.; Nwafulugo, F. U.; Ezetoha, N. O. Comparism of Response Surface Methodology (RSM) and Adaptive Neuro-Fuzzy Inference Systems (ANFIS) in Optimisation of Soybean Soapstock Biodiesel Production. Advances. 2024, 5(2), 49-63. doi: 10.11648/j.advances.20240502.13
AMA Style
Mbah CG, Nwafulugo FU, Ezetoha NO. Comparism of Response Surface Methodology (RSM) and Adaptive Neuro-Fuzzy Inference Systems (ANFIS) in Optimisation of Soybean Soapstock Biodiesel Production. Advances. 2024;5(2):49-63. doi: 10.11648/j.advances.20240502.13
@article{10.11648/j.advances.20240502.13,
  author = {Chinedu Gabriel Mbah and Francisca Unoma Nwafulugo and Njideka Ophelia Ezetoha},
  title = {Comparism of Response Surface Methodology (RSM) and Adaptive Neuro-Fuzzy Inference Systems (ANFIS) in Optimisation of Soybean Soapstock Biodiesel Production
},
  journal = {Advances},
  volume = {5},
  number = {2},
  pages = {49-63},
  doi = {10.11648/j.advances.20240502.13},
  url = {https://doi.org/10.11648/j.advances.20240502.13},
  eprint = {https://article.sciencepublishinggroup.com/pdf/10.11648.j.advances.20240502.13},
  abstract = {Soybean soapstock (SS), a lipid rich by-product of soybean oil production is a promising feedstock for the production ofbiodiesel due to its availability and affordability. In the esterification and transesterification reactions involving soyabeansoapstock, sodium hydroxide, methanol and n-hexane were used as catalyst, solvent and co-solvent respectively. The physico-chemical properties of the biodiesel obtained were determinedusing the Association of Analytical Chemist (AOAC) and American Society of Testing Materials (ASTM) methods. The esterification and transesterification reactions were optimised using both response surface methodology (RSM) under design expert 7.0 platform and Particle swarm technique in ANFIS (ANFIS-PSO) using the MATLAB software. The optimized acid value from the esterification reaction using RSM and ANFIS-PSO were 4.956 and 1.488 while the yield obtained were 97.29% and 99.91%respectively with ANFIS-PSO proving to be the better optimization technique in both cases. Comparison plots made for both reactions shows the ANFIS-PSO curve mirroring the experimental and thus signifying a closer trend when compared to the RSM curve. The suitability of the ANFIS-PSO prediction was further highlighted by the error analysis carried out on both techniques. The Residual sum of squares (RSS), Mean absolute error (MAE), Root mean square error (RMSE), Correlation coefficient (R), Coefficient of determination (R2), Adjusted R2, Absolute average deviation (AAD) and Mean absolute percent error (MAPE) values for the ANFIS-PSO predictions in both reactions were better than the RSM predictions. It can thus be concluded that soybean soapstock is a viable feedstock for biodiesel production and ANFIS-PSO is a more efficient optimization technique when compared with RSM in esterification and transesterification of soybean soapstock.
},
 year = {2024}
}
TY  - JOUR
T1  - Comparism of Response Surface Methodology (RSM) and Adaptive Neuro-Fuzzy Inference Systems (ANFIS) in Optimisation of Soybean Soapstock Biodiesel Production

AU  - Chinedu Gabriel Mbah
AU  - Francisca Unoma Nwafulugo
AU  - Njideka Ophelia Ezetoha
Y1  - 2024/07/08
PY  - 2024
N1  - https://doi.org/10.11648/j.advances.20240502.13
DO  - 10.11648/j.advances.20240502.13
T2  - Advances
JF  - Advances
JO  - Advances
SP  - 49
EP  - 63
PB  - Science Publishing Group
SN  - 2994-7200
UR  - https://doi.org/10.11648/j.advances.20240502.13
AB  - Soybean soapstock (SS), a lipid rich by-product of soybean oil production is a promising feedstock for the production ofbiodiesel due to its availability and affordability. In the esterification and transesterification reactions involving soyabeansoapstock, sodium hydroxide, methanol and n-hexane were used as catalyst, solvent and co-solvent respectively. The physico-chemical properties of the biodiesel obtained were determinedusing the Association of Analytical Chemist (AOAC) and American Society of Testing Materials (ASTM) methods. The esterification and transesterification reactions were optimised using both response surface methodology (RSM) under design expert 7.0 platform and Particle swarm technique in ANFIS (ANFIS-PSO) using the MATLAB software. The optimized acid value from the esterification reaction using RSM and ANFIS-PSO were 4.956 and 1.488 while the yield obtained were 97.29% and 99.91%respectively with ANFIS-PSO proving to be the better optimization technique in both cases. Comparison plots made for both reactions shows the ANFIS-PSO curve mirroring the experimental and thus signifying a closer trend when compared to the RSM curve. The suitability of the ANFIS-PSO prediction was further highlighted by the error analysis carried out on both techniques. The Residual sum of squares (RSS), Mean absolute error (MAE), Root mean square error (RMSE), Correlation coefficient (R), Coefficient of determination (R2), Adjusted R2, Absolute average deviation (AAD) and Mean absolute percent error (MAPE) values for the ANFIS-PSO predictions in both reactions were better than the RSM predictions. It can thus be concluded that soybean soapstock is a viable feedstock for biodiesel production and ANFIS-PSO is a more efficient optimization technique when compared with RSM in esterification and transesterification of soybean soapstock.

VL  - 5
IS  - 2
ER  -
Chemical Engineering Department, Federal Polytechnic, Oko, Nigeria
Chemical Engineering Department, Federal Polytechnic, Oko, Nigeria
Chemical Engineering Department, Federal Polytechnic, Oko, Nigeria
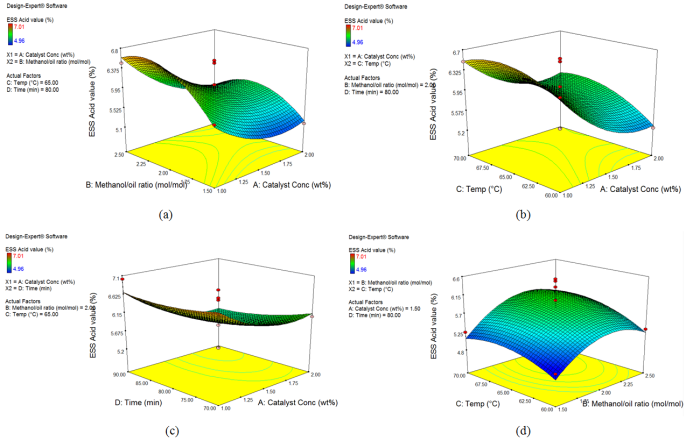
Figure 1. The 3D response surface plot of the effects of some variables on Acid value.
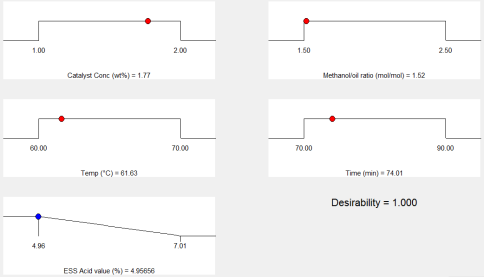
Figure 2. Ramps of the optimizationof esterification of soya soap stock.
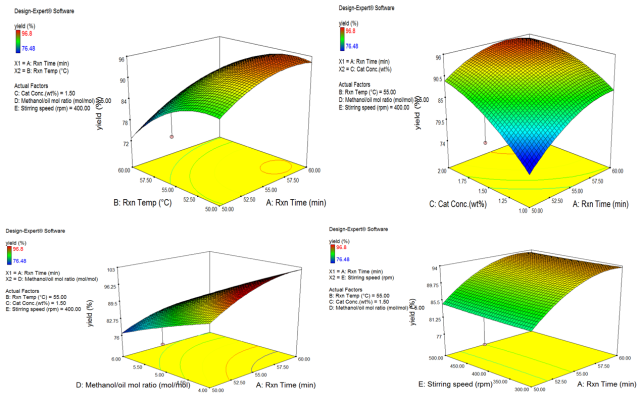
Figure 3. The 3D response surface plot of the effects of some variables on SSSME yield.
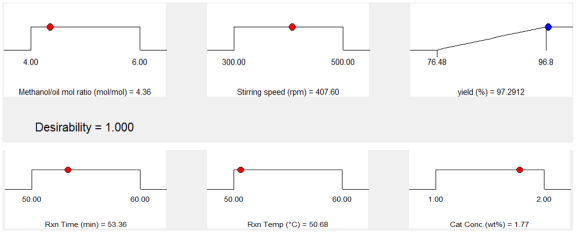
Figure 4. Ramps of the optimization of trans esterification of soya soap stock.
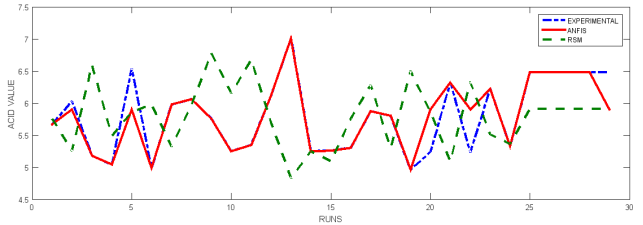
Figure 5. Comparison plots for optimization of esterification of soya soapstock.
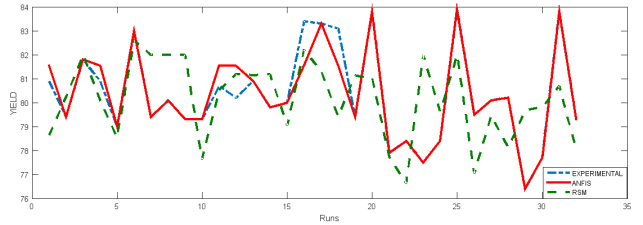
Figure 6. Comparison plots for optimization of transesterification of soya soap stock.
Information

