Hemoglobin A1c (HbA1c) measurement can be affected by hemoglobin variants through altered erythrocyte survival and method-specific analytical interference. This study assessed the influence of hemoglobin variants on HbA1c measurement by high-performance liquid chromatography (HPLC) in patients with hemoglobinopathy at Treichville University Hospital. This cross-sectional analytical study included 150 participants: 50 controls and 100 patients with confirmed hemoglobinopathy. Hemoglobin phenotypes were determined by electrophoresis. Blood glucose, complete blood count parameters, and the HPLC fractions HbA1c, HbA1a, HbA1b, and LA1C+ were measured. Group comparisons used the Mann-Whitney test, and phenotype comparisons used the Kruskal-Wallis test. The hemoglobinopathy group comprised SS (62%), SC (27%), AS (6%), an SFA2 electrophoretic profile (3%), and CC (2%). Mean blood glucose did not differ significantly between controls and participants with hemoglobinopathy (0.87 ± 0.13 g/L vs. 0.85 ± 0.07 g/L; p = 0.321). In contrast, mean HbA1c was markedly lower in the hemoglobinopathy group (1.29 ± 0.50% vs. 5.64 ± 0.54%; p < 0.001). Patients also had lower hemoglobin concentrations (8.75 ± 1.88 g/dL vs. 14.53 ± 1.58 g/dL; p < 0.001), indicating substantial anemia. HbA1c differed across electrophoretic categories (p = 0.0030), with the lowest values observed in CC and SFA2. LA1C+ also varied significantly by phenotype (p = 0.00011). Hemoglobin variants substantially affect HPLC HbA1c measurement and interpretation, producing a marked discordance between glycemia and HbA1c. In patients with hemoglobin variants, especially SS, SC, CC, or an SFA2 electrophoretic profile, HbA1c should not be interpreted in isolation and should be assessed alongside the chromatogram, blood glucose, hematological indices, and hemoglobin phenotype. Alternative glycemic markers may be required when HbA1c is unreliable.
This is an Open Access article, distributed under the terms of the Creative Commons Attribution 4.0 International License (http://creativecommons.org/licenses/by/4.0/), which permits unrestricted use, distribution and reproduction in any medium or format, provided the original work is properly cited.
Hemoglobin A1c (HbA1c) is a central marker of chronic glycemia and is widely used for the diagnosis and monitoring of diabetes mellitus
[1]
International Expert Committee. International Expert Committee report on the role of the A1C assay in the diagnosis of diabetes. Diabetes Care. 2009, 32(7), 1327-1334.
World Health Organization. Use of Glycated Haemoglobin (HbA1c) in the Diagnosis of Diabetes Mellitus. Geneva: World Health Organization; 2011.
[3]
Sacks, D. B., Arnold, M., Bakris, G. L., et al. Guidelines and recommendations for laboratory analysis in the diagnosis and management of diabetes mellitus. Clinical Chemistry. 2023, 69(8), 808-868.
American Diabetes Association Professional Practice Committee for Diabetes. 2. Diagnosis and classification of diabetes: Standards of Care in Diabetes—2026. Diabetes Care. 2026, 49(Suppl. 1), S27-S49.
. Its clinical interpretation assumes a standardized analytical method and a biological context in which erythrocyte survival is sufficiently normal for HbA1c to reflect average glucose exposure.
These assumptions are not always met in patients with hemoglobinopathies. Hemoglobin S (HbS) and hemoglobin C (HbC) are common in sub-Saharan Africa and can modify the relationship between blood glucose and HbA1c
[5]
Piel, F. B., Patil, A. P., Howes, R. E., et al. Global epidemiology of sickle haemoglobin in neonates: A contemporary geostatistical model-based map and population estimates. The Lancet. 2013, 381(9861), 142-151.
World Health Organization Regional Office for Africa. Sickle Cell Disease: The Silent Killer in Africa. Analytical Fact Sheet. Brazzaville: WHO Regional Office for Africa; 2024.
[5, 6]
. Hemoglobin variants may affect HbA1c through a biological mechanism, particularly chronic hemolysis and shortened erythrocyte lifespan, and through analytical interference that varies according to the assay method
[7]
Bry, L., Chen, P. C., Sacks, D. B. Effects of hemoglobin variants and chemically modified derivatives on assays for glycohemoglobin. Clinical Chemistry. 2001, 47(2), 153-163.
Little, R. R., Roberts, W. L. A review of variant hemoglobins interfering with hemoglobin A1c measurement. Journal of Diabetes Science and Technology. 2009, 3(3), 446-451.
High-performance liquid chromatography (HPLC) generates a chromatogram that displays several hemoglobin fractions. Its reliability nevertheless depends on the analytical system, chromatographic program, and correct identification and integration of peaks
[10]
Gillery, P. A history of HbA1c through clinical chemistry and laboratory medicine. Clinical Chemistry and Laboratory Medicine. 2013, 51(1), 65-74.
. In settings with a high prevalence of hemoglobinopathies, HbA1c results should therefore be interpreted together with the hemoglobin phenotype, hematological findings, chromatogram, and blood glucose concentration.
The objective of this study was to evaluate the influence of hemoglobin variants on HPLC measurement of HbA1c in patients with hemoglobinopathy followed at Treichville University Hospital.
2. Materials and Methods
2.1. Study Design, Setting, and Participants
This cross-sectional analytical study was conducted in the medical biology laboratory of Treichville University Hospital in Abidjan, Côte d’Ivoire. The study population comprised 150 participants divided into two groups: 50 controls and 100 patients with a confirmed hemoglobinopathy. The study was conducted after favorable review by the Medical Establishment Commission of Treichville University Hospital. The examinations were performed free of charge after informed consent was obtained from all included participants.
2.2. Hemoglobin Phenotyping and Hematological Measurements
Hemoglobin electrophoretic phenotypes were identified using the Hydrasys system (Sebia). The hematological parameters assessed were white blood cell count, red blood cell count, hemoglobin concentration, hematocrit, mean corpuscular volume, mean corpuscular hemoglobin, mean corpuscular hemoglobin concentration, and platelet count. These parameters were measured on a Sysmex XN-40 hematology analyzer. For the present analysis, the label SFA2 was retained as a single electrophoretic profile characterized by the concomitant detection of HbS, HbF, and HbA2. It was not treated as a combination of three separate phenotypes.
2.3. Biochemical and HPLC Analyses
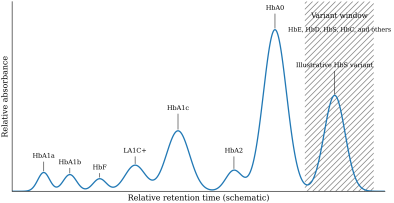
Blood glucose was measured by an enzymatic method on a Cobas C111 analyzer (Roche). HbA1c and the chromatographic subfractions HbA1a, HbA1b, and LA1C+ were measured by HPLC using the HumaNex A1c system (HUMAN), according to the analytical procedures in use in the laboratory. Chromatograms were reviewed to identify abnormal peaks and profiles suggestive of hemoglobin variants. The conceptual chromatogram in Figure 1 illustrates the principal fractions and the variant window of the HumaNex A1c Variant system; it is not an individual chromatogram from the study and does not provide locally validated retention times
[12]
HUMAN Gesellschaft für Biochemica und Diagnostica mbH. HumaNex A1c Variant: Fast. Reliable. Certified Gold-Standard. Wiesbaden: HUMAN; 2025. Document 981198/2025-07.
Figure 1. Conceptual HumaNex A1c Variant chromatogram showing HbA1c-related fractions and the variant window. This original schematic was prepared for this manuscript on the basis of the manufacturer documentation
[12]
HUMAN Gesellschaft für Biochemica und Diagnostica mbH. HumaNex A1c Variant: Fast. Reliable. Certified Gold-Standard. Wiesbaden: HUMAN; 2025. Document 981198/2025-07.
[12]
. It does not represent an individual study participant and must not be used as as a retention-time reference without local validation. Definitive variant identification requires a specific confirmatory method.
2.4. Statistical Analysis
Quantitative results were expressed as mean ± standard deviation and as minimum-maximum values where available. The Mann-Whitney test was used to compare controls with participants with hemoglobinopathy, and the Kruskal-Wallis test was used to compare the different hemoglobin phenotypes. A p value < 0.05 was considered statistically significant. Values initially reported as 0.0000 were presented as p < 0.001.
3. Results
3.1. Distribution of Hemoglobin Phenotypes
The SS and SC phenotypes accounted for 89% of the hemoglobinopathies observed. The remaining electrophoretic categories were AS, CC, and the SFA2 profile (Table 1).
Table 1. Distribution of electrophoretic phenotypes among participants with hemoglobinopathy (n = 100).
Phenotype
AS
SS
CC
SC
SFA2
A1A2
Total
Number (n)
6
62
2
27
3
0
100
Percentage (%)
6.0
62.0
2.0
27.0
3.0
0.0
100.0
AS: sickle cell trait; SS: homozygous sickle cell disease; SC: compound heterozygosity; CC: homozygous hemoglobin C disease; SFA2: electrophoretic profile showing HbS, HbF, and HbA2. In this study, SFA2 denotes one laboratory profile and not a combination of three independent phenotypes.
3.2. Hematological Findings
Participants with hemoglobinopathy had marked anemia, with significantly lower hemoglobin concentration, hematocrit, and red blood cell count than controls (all p < 0.001). Mean corpuscular volume was also lower (p = 0.0073). Differences in mean corpuscular hemoglobin, mean corpuscular hemoglobin concentration, and platelet count did not reach statistical significance (Table 2).
Table 2. Hematological parameters in controls and participants with hemoglobinopathy.
Parameter
Controls (n = 50) Mean ± SD
Controls Min-Max
Hemoglobinopathy (n = 100) Mean ± SD
Hemoglobinopathy Min-Max
p
WBC
5.56 ± 2.51
0.3-16.8
12.16 ± 8.33
2.94-60.34
< 0.001
RBC
5.21 ± 0.64
4.00-6.90
3.42 ± 1.05
1.51-8.60
< 0.001
Hb
14.53 ± 1.58
12.2-19.1
8.75 ± 1.88
5.10-13.00
< 0.001
Hct
44.05 ± 4.50
36.9-56.7
25.91 ± 5.76
15.4-38.7
< 0.001
MCV
82.81 ± 7.54
67.4-93.9
77.74 ± 11.27
10.43-98.8
0.0073
MCH
27.72 ± 2.26
23.1-32.0
26.58 ± 3.70
16.1-36.3
0.0953
MCHC
33.20 ± 1.34
30.7-36.0
33.58 ± 1.49
27.9-36.4
0.1663
Platelets
225.18 ± 68.22
61-433
347 ± 148
18-650
0.0578
WBC: white blood cells; RBC: red blood cells; Hb: hemoglobin; Hct: hematocrit; MCV: mean corpuscular volume; MCH: mean corpuscular hemoglobin; MCHC: mean corpuscular hemoglobin concentration.
3.3. HbA1c and Chromatographic Subfractions
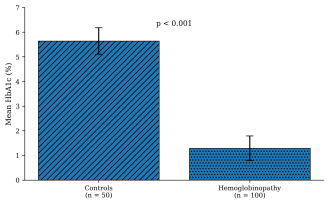
Mean HbA1c was markedly lower in participants with hemoglobinopathy than in controls (1.29 ± 0.50% vs. 5.64 ± 0.54%; p < 0.001). By contrast, HbA1a was higher in the hemoglobinopathy group, suggesting redistribution of chromatographic fractions. LA1C+ was lower in the hemoglobinopathy group, whereas the difference in HbA1b was at the threshold of statistical significance (Table 3). Figure 2 summarizes the difference in mean HbA1c between groups.
Figure 2. Comparison of mean HbA1c between controls and participants with hemoglobinopathy. Bars represent mean ± standard deviation. The between-group difference was statistically significant (p < 0.001).

Table 3. HbA1c and chromatographic subfractions in the two study groups.
HPLC fraction
Controls (n = 50) Mean ± SD
Controls Min-Max
Hemoglobinopathy (n = 100) Mean ± SD
Hemoglobinopathy Min-Max
p
HbA1c (%)
5.64 ± 0.54
4.0-6.3
1.29 ± 0.50
0.05-5.7
< 0.001
HbA1a (%)
0.29 ± 0.10
0.2-0.6
1.04 ± 0.82
0.1-4.2
< 0.001
HbA1b (%)
0.86 ± 0.25
0.1-1.4
0.87 ± 0.86
0.1-5.5
0.050
LA1C+ (%)
2.19 ± 0.55
1.0-5.3
0.99 ± 0.99
0.1-4.0
< 0.001
Fractions are expressed as percentages. LA1C+: labile/associated HbA1c fraction as defined by the HPLC system used.
3.4. Chromatographic Fractions According to Hemoglobin Phenotype
HbA1c differed significantly across electrophoretic categories (p = 0.0030). The lowest values were observed in CC and the SFA2 electrophoretic profile. LA1C+ also varied significantly according to electrophoretic category (p = 0.00011), whereas HbA1a and HbA1b did not show significant between-phenotype variation (Table 4).
Table 4. HPLC subfractions according to electrophoretic phenotype.
Phenotype
n
HbA1c (%) Mean ± SD
HbA1a (%) Mean ± SD
HbA1b (%) Mean ± SD
LA1C+ (%) Mean ± SD
AS
6
1.74 ± 2.07
0.97 ± 0.73
0.93 ± 0.72
1.47 ± 1.16
SS
62
0.43 ± 1.36
1.15 ± 0.86
0.94 ± 0.80
0.96 ± 1.04
CC
2
0.05 ± 0.00
0.55 ± 0.07
0.35 ± 0.07
0.35 ± 0.21
SC
27
0.77 ± 1.64
0.79 ± 0.75
0.74 ± 1.08
1.00 ± 0.92
SFA2
3
0.05 ± 0.00
1.50 ± 0.61
0.63 ± 0.32
0.83 ± 0.67
P
0.0030
0.1010
0.4905
0.00011
Values are mean ± standard deviation. The p values evaluate variation across electrophoretic phenotypes.
3.5. Discordance Between Blood Glucose and HbA1c
The combined analysis showed a major discordance: mean blood glucose was comparable between groups, whereas HbA1c was markedly lower in participants with hemoglobinopathy. The concomitant anemia provides a biological explanation for at least part of this discordance (Table 5).
Table 5. Discordance between blood glucose, hemoglobin concentration, and HbA1c according to study group.
Parameter
Controls (n = 50) Mean ± SD
Hemoglobinopathy (n = 100) Mean ± SD
p
Interpretation
Blood glucose (g/L)
0.87 ± 0.13
0.85 ± 0.07
0.321
Comparable blood glucose
HbA1c (%)
5.64 ± 0.54
1.29 ± 0.50
< 0.001
Marked decrease with hemoglobinopathy
Hemoglobin (g/dL)
14.53 ± 1.58
8.75 ± 1.88
< 0.001
Anemia associated with hemoglobinopathy
This table summarizes the major blood glucose-HbA1c discordance and the associated anemia as a biological factor contributing to low HbA1c.
4. Discussion
This study demonstrates a major influence of hemoglobin variants on HPLC measurement of HbA1c among patients with hemoglobinopathy at Treichville University Hospital. The principal finding was the marked discordance between comparable mean blood glucose concentrations in controls and participants with hemoglobinopathy and a substantially lower mean HbA1c in the hemoglobinopathy group.
The predominance of SS and SC phenotypes underscores the relevance of this finding in an African setting where hemoglobinopathies remain an important public health problem
[5]
Piel, F. B., Patil, A. P., Howes, R. E., et al. Global epidemiology of sickle haemoglobin in neonates: A contemporary geostatistical model-based map and population estimates. The Lancet. 2013, 381(9861), 142-151.
World Health Organization Regional Office for Africa. Sickle Cell Disease: The Silent Killer in Africa. Analytical Fact Sheet. Brazzaville: WHO Regional Office for Africa; 2024.
[5, 6]
. In these patients, an isolated HbA1c result may falsely suggest low average glycemia or satisfactory glycemic control, although the measured value is strongly influenced by the hemoglobin phenotype and erythrocyte kinetics.
The most plausible biological mechanism is shortened erythrocyte survival. HbA1c forms progressively during the lifespan of the red blood cell. When chronic hemolysis reduces erythrocyte age, the duration of hemoglobin exposure to glucose is shortened, lowering HbA1c independently of the true glycemic status
[11]
Weykamp, C. HbA1c: A review of analytical and clinical aspects. Annals of Laboratory Medicine. 2013, 33(6), 393-400.
. This mechanism is particularly relevant to SS and SC disease, which are associated with chronic anemia and hemolysis. The substantially lower hemoglobin concentration observed in the hemoglobinopathy group supports this interpretation.
Method-specific analytical interference adds to this biological effect. Hemoglobin variants may alter retention times, co-elute with measured fractions, shift HbA1a, HbA1b, or LA1C+ peaks, or compromise automated peak integration
[7]
Bry, L., Chen, P. C., Sacks, D. B. Effects of hemoglobin variants and chemically modified derivatives on assays for glycohemoglobin. Clinical Chemistry. 2001, 47(2), 153-163.
Little, R. R., Roberts, W. L. A review of variant hemoglobins interfering with hemoglobin A1c measurement. Journal of Diabetes Science and Technology. 2009, 3(3), 446-451.
. Method-comparison studies have confirmed that the magnitude and direction of interference depend on the specific variant, heterozygous or homozygous status, and the analytical platform
[14]
Lin, C. N., Emery, T. J., Little, R. R., et al. Effects of hemoglobin C, D, E, and S traits on measurements of HbA1c by six methods. Clinica Chimica Acta. 2012, 413(7-8), 819-821.
Little, R. R., Rohlfing, C. L., Hanson, S., et al. Effects of 49 different rare Hb variants on HbA1c measurement in eight methods. Journal of Diabetes Science and Technology. 2015, 9(4), 849-856.
Li, M., Ge, S., Shu, X., et al. Interference of hemoglobin variants with HbA1c measurements by six commonly used HbA1c methods. Laboratory Medicine. 2024, 55(6), 708-712.
. The HumaNex A1c Variant system displays a variant window and is designed to detect common variants such as HbC, HbE, HbD, and HbS, but any abnormal chromatographic pattern must be interpreted cautiously and confirmed by a specific hemoglobin-identification method
[12]
HUMAN Gesellschaft für Biochemica und Diagnostica mbH. HumaNex A1c Variant: Fast. Reliable. Certified Gold-Standard. Wiesbaden: HUMAN; 2025. Document 981198/2025-07.
[12]
.
Our findings are consistent with those of Lacy et al., who reported lower HbA1c for a given level of glycemia among African American individuals with sickle cell trait
[19]
Lacy, M. E., Wellenius, G. A., Sumner, A. E., et al. Association of sickle cell trait with hemoglobin A1c in African Americans. JAMA. 2017, 317(5), 507-515.
. They also agree with the local study by Lohoré et al. in Abidjan, which included 94 HbAS participants and 76 HbAA controls. In that study, HbA1c was significantly lower in HbAS participants than in controls (5.03 ± 0.67% vs. 5.57 ± 0.39%; p < 0.0001)
[20]
Lohoré, K. C. J., Yapo-Kee Aké, C. B., Moke, L., Ecrabey, Y. C., Bouberi-Niava, B., Kouamé, B. G. M., et al. Impact of sickle cell trait on glycated hemoglobin levels in Abidjan. African Journal of Biochemistry Research. 2025, 19(1), 1-6.
. The present study extends this observation to major electrophoretic categories, including SS, SC, CC, and the SFA2 profile, in which hemolysis and the absence or low proportion of HbA may make HbA1c interpretation even more difficult. Importantly, SFA2 in this manuscript is an electrophoretic profile label: HbS, HbF, and HbA2 are fractions detected within the same profile, and HbA2 is not being treated as a separate phenotype.
Recent studies from sub-Saharan Africa likewise emphasize the importance of hemoglobin type, hematological parameters, and local validation of HbA1c methods
[21]
Balungi, P. A., Niwaha, A., Nice, R., et al. Impact of haemoglobin variants on the diagnostic sensitivity of glycated haemoglobin (HbA1c) assay methodologies in sub-Saharan Africa: A laboratory-based method validation study. Pan African Medical Journal. 2024, 48, 10.
Malaba, J., Kosiyo, P., Guyah, B. Haemoglobin types and variant interference with HbA1c and its association with uncontrolled HbA1c in type 2 diabetes mellitus. BMC Research Notes. 2024, 17, 342.
. In routine practice, the laboratory report should flag abnormal chromatographic patterns or suspected interference. HbA1c should be assessed in relation to blood glucose, the complete blood count, mean corpuscular volume, hemoglobin concentration, and the electrophoretic phenotype. When HbA1c is discordant or unreliable, fructosamine or glycated albumin may be considered, while recognizing their limitations in patients with abnormal albumin concentration, inflammation, or hepatic or renal disease
[23]
Danese, E., Montagnana, M., Nouvenne, A., Lippi, G. Advantages and pitfalls of fructosamine and glycated albumin in the diagnosis and treatment of diabetes. Journal of Diabetes Science and Technology. 2015, 9(2), 169-176.
Doumatey, A. P., Feron, H., Ekoru, K., et al. Serum fructosamine and glycemic status in the presence of the sickle cell mutation. Diabetes Research and Clinical Practice. 2021, 177, 108918.
This study has several limitations. Its cross-sectional design precluded longitudinal assessment. HbA1c was not compared with a non-HPLC method, continuous glucose monitoring, fructosamine, or glycated albumin. The CC group and the SFA2 electrophoretic-profile group were small, limiting subgroup-specific inference. The SFA2 label was analyzed descriptively as reported by electrophoresis and was not used as a molecular-genotype designation. Nevertheless, the large HbA1c-blood glucose discordance and the simultaneous hematological findings provide clinically relevant evidence that HbA1c cannot be interpreted in isolation in this population.
5. Conclusions
Hemoglobin variants significantly affected HPLC measurement and interpretation of HbA1c in patients with hemoglobinopathy. HbA1c was markedly reduced despite blood glucose concentrations comparable to those of controls, demonstrating an important biological and clinical discordance. In patients with SS, SC, CC, an SFA2 electrophoretic profile, or other hemoglobin variants, HbA1c should be interpreted together with the chromatogram, blood glucose, hematological findings, and electrophoretic phenotype. Alternative glycemic markers should be considered when HbA1c is judged unreliable.
Abbreviations
HbA1c
Glycated Hemoglobin A1c
HPLC
High-performance Liquid Chromatography
HbS
Hemoglobin S
HbC
Hemoglobin C
HbF
Fetal Hemoglobin
HbA2
Hemoglobin A2
WBC
White Blood Cell Count
RBC
Red Blood Cell Count
Hb
Hemoglobin
Hct
Hematocrit
MCV
Mean Corpuscular Volume
MCH
Mean Corpuscular Hemoglobin
MCHC
Mean Corpuscular Hemoglobin Concentration
NGSP
National Glycohemoglobin Standardization Program
LA1c+
Labile HbA1c Fraction
Author Contributions
Koffi Konan Gervais: Conceptualization, Methodology, Writing – original draft
Niamke Amenan Guy Germaine: Data curation, Formal Analysis, Investigation, Writing – review & editing
Monde Ake Absalome: Supervision, Validation, Writing – review & editing
Conflicts of Interest
The authors declare that they have no conflicts of interest.
References
[1]
International Expert Committee. International Expert Committee report on the role of the A1C assay in the diagnosis of diabetes. Diabetes Care. 2009, 32(7), 1327-1334.
World Health Organization. Use of Glycated Haemoglobin (HbA1c) in the Diagnosis of Diabetes Mellitus. Geneva: World Health Organization; 2011.
[3]
Sacks, D. B., Arnold, M., Bakris, G. L., et al. Guidelines and recommendations for laboratory analysis in the diagnosis and management of diabetes mellitus. Clinical Chemistry. 2023, 69(8), 808-868.
American Diabetes Association Professional Practice Committee for Diabetes. 2. Diagnosis and classification of diabetes: Standards of Care in Diabetes—2026. Diabetes Care. 2026, 49(Suppl. 1), S27-S49.
Piel, F. B., Patil, A. P., Howes, R. E., et al. Global epidemiology of sickle haemoglobin in neonates: A contemporary geostatistical model-based map and population estimates. The Lancet. 2013, 381(9861), 142-151.
World Health Organization Regional Office for Africa. Sickle Cell Disease: The Silent Killer in Africa. Analytical Fact Sheet. Brazzaville: WHO Regional Office for Africa; 2024.
[7]
Bry, L., Chen, P. C., Sacks, D. B. Effects of hemoglobin variants and chemically modified derivatives on assays for glycohemoglobin. Clinical Chemistry. 2001, 47(2), 153-163.
Little, R. R., Roberts, W. L. A review of variant hemoglobins interfering with hemoglobin A1c measurement. Journal of Diabetes Science and Technology. 2009, 3(3), 446-451.
HUMAN Gesellschaft für Biochemica und Diagnostica mbH. HumaNex A1c Variant: Fast. Reliable. Certified Gold-Standard. Wiesbaden: HUMAN; 2025. Document 981198/2025-07.
[13]
National Glycohemoglobin Standardization Program. Factors that Interfere with HbA1c Test Results [Internet]. Available from:
Lin, C. N., Emery, T. J., Little, R. R., et al. Effects of hemoglobin C, D, E, and S traits on measurements of HbA1c by six methods. Clinica Chimica Acta. 2012, 413(7-8), 819-821.
Little, R. R., Rohlfing, C. L., Hanson, S., et al. Effects of 49 different rare Hb variants on HbA1c measurement in eight methods. Journal of Diabetes Science and Technology. 2015, 9(4), 849-856.
Li, M., Ge, S., Shu, X., et al. Interference of hemoglobin variants with HbA1c measurements by six commonly used HbA1c methods. Laboratory Medicine. 2024, 55(6), 708-712.
Lacy, M. E., Wellenius, G. A., Sumner, A. E., et al. Association of sickle cell trait with hemoglobin A1c in African Americans. JAMA. 2017, 317(5), 507-515.
Lohoré, K. C. J., Yapo-Kee Aké, C. B., Moke, L., Ecrabey, Y. C., Bouberi-Niava, B., Kouamé, B. G. M., et al. Impact of sickle cell trait on glycated hemoglobin levels in Abidjan. African Journal of Biochemistry Research. 2025, 19(1), 1-6.
Balungi, P. A., Niwaha, A., Nice, R., et al. Impact of haemoglobin variants on the diagnostic sensitivity of glycated haemoglobin (HbA1c) assay methodologies in sub-Saharan Africa: A laboratory-based method validation study. Pan African Medical Journal. 2024, 48, 10.
Malaba, J., Kosiyo, P., Guyah, B. Haemoglobin types and variant interference with HbA1c and its association with uncontrolled HbA1c in type 2 diabetes mellitus. BMC Research Notes. 2024, 17, 342.
Danese, E., Montagnana, M., Nouvenne, A., Lippi, G. Advantages and pitfalls of fructosamine and glycated albumin in the diagnosis and treatment of diabetes. Journal of Diabetes Science and Technology. 2015, 9(2), 169-176.
Doumatey, A. P., Feron, H., Ekoru, K., et al. Serum fructosamine and glycemic status in the presence of the sickle cell mutation. Diabetes Research and Clinical Practice. 2021, 177, 108918.
Gervais, K. K., Germaine, N. A. G., Chantal, G., Benedicte, Y. A. C., Christian, E. Y., et al. (2026). Hemoglobin Variants Affect HPLC Measurement of HbA1c at Treichville University Hospital. Advances in Biochemistry, 14(3), 72-78. https://doi.org/10.11648/j.ab.20261403.12
Gervais, K. K.; Germaine, N. A. G.; Chantal, G.; Benedicte, Y. A. C.; Christian, E. Y., et al. Hemoglobin Variants Affect HPLC Measurement of HbA1c at Treichville University Hospital. Adv. Biochem.2026, 14(3), 72-78. doi: 10.11648/j.ab.20261403.12
@article{10.11648/j.ab.20261403.12,
author = {Koffi Konan Gervais and Niamke Amenan Guy Germaine and Gauze-Gnagne Chantal and Yapo-Kee Ake Chibrou Benedicte and Ecrabey Yann Christian and Lohore Kouzahon Colombe Jeannine and Djohan Youzan Ferdinand and Monde Ake Absalome},
title = {Hemoglobin Variants Affect HPLC Measurement of HbA1c at Treichville University Hospital},
journal = {Advances in Biochemistry},
volume = {14},
number = {3},
pages = {72-78},
doi = {10.11648/j.ab.20261403.12},
url = {https://doi.org/10.11648/j.ab.20261403.12},
eprint = {https://article.sciencepublishinggroup.com/pdf/10.11648.j.ab.20261403.12},
abstract = {Hemoglobin A1c (HbA1c) measurement can be affected by hemoglobin variants through altered erythrocyte survival and method-specific analytical interference. This study assessed the influence of hemoglobin variants on HbA1c measurement by high-performance liquid chromatography (HPLC) in patients with hemoglobinopathy at Treichville University Hospital. This cross-sectional analytical study included 150 participants: 50 controls and 100 patients with confirmed hemoglobinopathy. Hemoglobin phenotypes were determined by electrophoresis. Blood glucose, complete blood count parameters, and the HPLC fractions HbA1c, HbA1a, HbA1b, and LA1C+ were measured. Group comparisons used the Mann-Whitney test, and phenotype comparisons used the Kruskal-Wallis test. The hemoglobinopathy group comprised SS (62%), SC (27%), AS (6%), an SFA2 electrophoretic profile (3%), and CC (2%). Mean blood glucose did not differ significantly between controls and participants with hemoglobinopathy (0.87 ± 0.13 g/L vs. 0.85 ± 0.07 g/L; p = 0.321). In contrast, mean HbA1c was markedly lower in the hemoglobinopathy group (1.29 ± 0.50% vs. 5.64 ± 0.54%; p < 0.001). Patients also had lower hemoglobin concentrations (8.75 ± 1.88 g/dL vs. 14.53 ± 1.58 g/dL; p < 0.001), indicating substantial anemia. HbA1c differed across electrophoretic categories (p = 0.0030), with the lowest values observed in CC and SFA2. LA1C+ also varied significantly by phenotype (p = 0.00011). Hemoglobin variants substantially affect HPLC HbA1c measurement and interpretation, producing a marked discordance between glycemia and HbA1c. In patients with hemoglobin variants, especially SS, SC, CC, or an SFA2 electrophoretic profile, HbA1c should not be interpreted in isolation and should be assessed alongside the chromatogram, blood glucose, hematological indices, and hemoglobin phenotype. Alternative glycemic markers may be required when HbA1c is unreliable.},
year = {2026}
}
TY - JOUR
T1 - Hemoglobin Variants Affect HPLC Measurement of HbA1c at Treichville University Hospital
AU - Koffi Konan Gervais
AU - Niamke Amenan Guy Germaine
AU - Gauze-Gnagne Chantal
AU - Yapo-Kee Ake Chibrou Benedicte
AU - Ecrabey Yann Christian
AU - Lohore Kouzahon Colombe Jeannine
AU - Djohan Youzan Ferdinand
AU - Monde Ake Absalome
Y1 - 2026/09/09
PY - 2026
N1 - https://doi.org/10.11648/j.ab.20261403.12
DO - 10.11648/j.ab.20261403.12
T2 - Advances in Biochemistry
JF - Advances in Biochemistry
JO - Advances in Biochemistry
SP - 72
EP - 78
PB - Science Publishing Group
SN - 2329-0862
UR - https://doi.org/10.11648/j.ab.20261403.12
AB - Hemoglobin A1c (HbA1c) measurement can be affected by hemoglobin variants through altered erythrocyte survival and method-specific analytical interference. This study assessed the influence of hemoglobin variants on HbA1c measurement by high-performance liquid chromatography (HPLC) in patients with hemoglobinopathy at Treichville University Hospital. This cross-sectional analytical study included 150 participants: 50 controls and 100 patients with confirmed hemoglobinopathy. Hemoglobin phenotypes were determined by electrophoresis. Blood glucose, complete blood count parameters, and the HPLC fractions HbA1c, HbA1a, HbA1b, and LA1C+ were measured. Group comparisons used the Mann-Whitney test, and phenotype comparisons used the Kruskal-Wallis test. The hemoglobinopathy group comprised SS (62%), SC (27%), AS (6%), an SFA2 electrophoretic profile (3%), and CC (2%). Mean blood glucose did not differ significantly between controls and participants with hemoglobinopathy (0.87 ± 0.13 g/L vs. 0.85 ± 0.07 g/L; p = 0.321). In contrast, mean HbA1c was markedly lower in the hemoglobinopathy group (1.29 ± 0.50% vs. 5.64 ± 0.54%; p < 0.001). Patients also had lower hemoglobin concentrations (8.75 ± 1.88 g/dL vs. 14.53 ± 1.58 g/dL; p < 0.001), indicating substantial anemia. HbA1c differed across electrophoretic categories (p = 0.0030), with the lowest values observed in CC and SFA2. LA1C+ also varied significantly by phenotype (p = 0.00011). Hemoglobin variants substantially affect HPLC HbA1c measurement and interpretation, producing a marked discordance between glycemia and HbA1c. In patients with hemoglobin variants, especially SS, SC, CC, or an SFA2 electrophoretic profile, HbA1c should not be interpreted in isolation and should be assessed alongside the chromatogram, blood glucose, hematological indices, and hemoglobin phenotype. Alternative glycemic markers may be required when HbA1c is unreliable.
VL - 14
IS - 3
ER -
Gervais, K. K., Germaine, N. A. G., Chantal, G., Benedicte, Y. A. C., Christian, E. Y., et al. (2026). Hemoglobin Variants Affect HPLC Measurement of HbA1c at Treichville University Hospital. Advances in Biochemistry, 14(3), 72-78. https://doi.org/10.11648/j.ab.20261403.12
Gervais, K. K.; Germaine, N. A. G.; Chantal, G.; Benedicte, Y. A. C.; Christian, E. Y., et al. Hemoglobin Variants Affect HPLC Measurement of HbA1c at Treichville University Hospital. Adv. Biochem.2026, 14(3), 72-78. doi: 10.11648/j.ab.20261403.12
@article{10.11648/j.ab.20261403.12,
author = {Koffi Konan Gervais and Niamke Amenan Guy Germaine and Gauze-Gnagne Chantal and Yapo-Kee Ake Chibrou Benedicte and Ecrabey Yann Christian and Lohore Kouzahon Colombe Jeannine and Djohan Youzan Ferdinand and Monde Ake Absalome},
title = {Hemoglobin Variants Affect HPLC Measurement of HbA1c at Treichville University Hospital},
journal = {Advances in Biochemistry},
volume = {14},
number = {3},
pages = {72-78},
doi = {10.11648/j.ab.20261403.12},
url = {https://doi.org/10.11648/j.ab.20261403.12},
eprint = {https://article.sciencepublishinggroup.com/pdf/10.11648.j.ab.20261403.12},
abstract = {Hemoglobin A1c (HbA1c) measurement can be affected by hemoglobin variants through altered erythrocyte survival and method-specific analytical interference. This study assessed the influence of hemoglobin variants on HbA1c measurement by high-performance liquid chromatography (HPLC) in patients with hemoglobinopathy at Treichville University Hospital. This cross-sectional analytical study included 150 participants: 50 controls and 100 patients with confirmed hemoglobinopathy. Hemoglobin phenotypes were determined by electrophoresis. Blood glucose, complete blood count parameters, and the HPLC fractions HbA1c, HbA1a, HbA1b, and LA1C+ were measured. Group comparisons used the Mann-Whitney test, and phenotype comparisons used the Kruskal-Wallis test. The hemoglobinopathy group comprised SS (62%), SC (27%), AS (6%), an SFA2 electrophoretic profile (3%), and CC (2%). Mean blood glucose did not differ significantly between controls and participants with hemoglobinopathy (0.87 ± 0.13 g/L vs. 0.85 ± 0.07 g/L; p = 0.321). In contrast, mean HbA1c was markedly lower in the hemoglobinopathy group (1.29 ± 0.50% vs. 5.64 ± 0.54%; p < 0.001). Patients also had lower hemoglobin concentrations (8.75 ± 1.88 g/dL vs. 14.53 ± 1.58 g/dL; p < 0.001), indicating substantial anemia. HbA1c differed across electrophoretic categories (p = 0.0030), with the lowest values observed in CC and SFA2. LA1C+ also varied significantly by phenotype (p = 0.00011). Hemoglobin variants substantially affect HPLC HbA1c measurement and interpretation, producing a marked discordance between glycemia and HbA1c. In patients with hemoglobin variants, especially SS, SC, CC, or an SFA2 electrophoretic profile, HbA1c should not be interpreted in isolation and should be assessed alongside the chromatogram, blood glucose, hematological indices, and hemoglobin phenotype. Alternative glycemic markers may be required when HbA1c is unreliable.},
year = {2026}
}
TY - JOUR
T1 - Hemoglobin Variants Affect HPLC Measurement of HbA1c at Treichville University Hospital
AU - Koffi Konan Gervais
AU - Niamke Amenan Guy Germaine
AU - Gauze-Gnagne Chantal
AU - Yapo-Kee Ake Chibrou Benedicte
AU - Ecrabey Yann Christian
AU - Lohore Kouzahon Colombe Jeannine
AU - Djohan Youzan Ferdinand
AU - Monde Ake Absalome
Y1 - 2026/09/09
PY - 2026
N1 - https://doi.org/10.11648/j.ab.20261403.12
DO - 10.11648/j.ab.20261403.12
T2 - Advances in Biochemistry
JF - Advances in Biochemistry
JO - Advances in Biochemistry
SP - 72
EP - 78
PB - Science Publishing Group
SN - 2329-0862
UR - https://doi.org/10.11648/j.ab.20261403.12
AB - Hemoglobin A1c (HbA1c) measurement can be affected by hemoglobin variants through altered erythrocyte survival and method-specific analytical interference. This study assessed the influence of hemoglobin variants on HbA1c measurement by high-performance liquid chromatography (HPLC) in patients with hemoglobinopathy at Treichville University Hospital. This cross-sectional analytical study included 150 participants: 50 controls and 100 patients with confirmed hemoglobinopathy. Hemoglobin phenotypes were determined by electrophoresis. Blood glucose, complete blood count parameters, and the HPLC fractions HbA1c, HbA1a, HbA1b, and LA1C+ were measured. Group comparisons used the Mann-Whitney test, and phenotype comparisons used the Kruskal-Wallis test. The hemoglobinopathy group comprised SS (62%), SC (27%), AS (6%), an SFA2 electrophoretic profile (3%), and CC (2%). Mean blood glucose did not differ significantly between controls and participants with hemoglobinopathy (0.87 ± 0.13 g/L vs. 0.85 ± 0.07 g/L; p = 0.321). In contrast, mean HbA1c was markedly lower in the hemoglobinopathy group (1.29 ± 0.50% vs. 5.64 ± 0.54%; p < 0.001). Patients also had lower hemoglobin concentrations (8.75 ± 1.88 g/dL vs. 14.53 ± 1.58 g/dL; p < 0.001), indicating substantial anemia. HbA1c differed across electrophoretic categories (p = 0.0030), with the lowest values observed in CC and SFA2. LA1C+ also varied significantly by phenotype (p = 0.00011). Hemoglobin variants substantially affect HPLC HbA1c measurement and interpretation, producing a marked discordance between glycemia and HbA1c. In patients with hemoglobin variants, especially SS, SC, CC, or an SFA2 electrophoretic profile, HbA1c should not be interpreted in isolation and should be assessed alongside the chromatogram, blood glucose, hematological indices, and hemoglobin phenotype. Alternative glycemic markers may be required when HbA1c is unreliable.
VL - 14
IS - 3
ER -