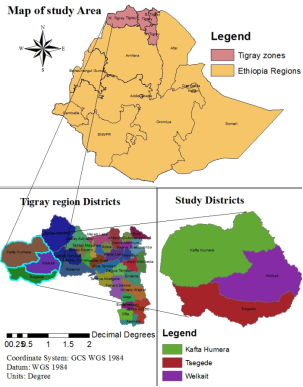
The study was conducted to characterize morphometric traits of indigenous chickens and determine the relationships among the traits in three agro-climatic regions of western zone of Tigray regional state of Ethiopia. Twenty- one morphometric traits from 770 local chickens (412 hens, 358 cocks) were measured and analyzed using the PROC GLM of SAS 2008. Tukey mean comparison was used to analyze significantly different traits. Correlation analysis was used to determine the relationships among the traits. Significant variations were found in most traits among ecotypes, with males showing higher values in many traits. Kolla chickens generally exhibited higher values, except for neck length, skull length, and wattle, earlobe, comb, and beak indices. Interactions between sex and ecotypes significantly affected the morphometric traits. The strength and direction of significant correlations among the quantitative traits varied across the chicken ecotypes and sexes. The variation in morphometric measurements among the chicken ecotypes is an indicator of genetic diversity in the study area, calling for a community-centered holistic genetic enhancement program.
| Published in | Ecology and Evolutionary Biology (Volume 9, Issue 2) |
| DOI | 10.11648/j.eeb.20240902.12 |
| Page(s) | 37-60 |
| Creative Commons |
This is an Open Access article, distributed under the terms of the Creative Commons Attribution 4.0 International License (http://creativecommons.org/licenses/by/4.0/), which permits unrestricted use, distribution and reproduction in any medium or format, provided the original work is properly cited. |
| Copyright |
Copyright © The Author(s), 2024. Published by Science Publishing Group |
Quantitative Trait, Chicken Ecotypes, Kolla, Weynadega, Dega
Traits | Agro-climatic zones | |||
|---|---|---|---|---|
Kolla (N = 310) | Weynadega (N = 260) | Dega(N = 200) | CV | |
Body length (cm) | 31.88±0.06a | 30.50±0.07 b | 28.16± 0.08 c | 3.72 |
Body weight (kg) | 1.474±0.004a | 1.425± 0.005b | 1.346±0.005c | 5.34 |
Shank length (cm) | 10.37±0.03a | 9.55± 0.04b | 9.07±0.04c | 6.24 |
Comb length (cm) | 5.11± 0.026a | 4.46± 0.029b | 4.13± 0.033c | 10.1 |
Comb width (cm) | 2.64± 0.01a | 2.13± 0.01c | 2.28± 0.02b | 9.47 |
Comb index | 1.93± 0.01b | 2.07±0.02a | 1.84± 0.02c | 13.22 |
Earlobe length (cm) | 2.59±0.01a | 1.90±0.01c | 2.47± 0.01b | 7.85 |
Earlobe width (cm) | 1.55± 0.01 a | 1.01± 0.01 b | 1.55±0.01 a | 13.92 |
Earlobe index | 1.74± 0.02 b | 1.90±0.02a | 1.61±0.02c | 15.65 |
Wattle length (cm) | 4.16± 0.03 a | 3.24±0.04 c | 3.69± 0.04b | 16.83 |
Wattle width (cm) | 2.66±0.03 a | 1.92±0.03 c | 2.38± 0.03b | 21.69 |
Wattle index | 1.61±0.02b | 1.86± 0.02a | 1.59± 0.02b | 20.82 |
Skull length (cm) | 6.20±0.05b | 6.66± 0.05 a | 6.51± 0.06 a | 12.91 |
Skull width (cm) | 3.79± 0.04a | 3.85± 0.04a | 3.73±0.04a | 16.57 |
Skull index | 1.70± 0.01b | 1.77± 0.02 a | 1.77± 0.02 a | 14.54 |
Neck length (cm) | 14.71± 0.05b | 16.27±0.06a | 12.93±0.06b | 6.30 |
Beak length (cm) | 2.13± 0.01a | 2.07± 0.01b | 2.02±0.01c | 9.29 |
Beak width (cm) | 1.16±0.01a | 0.95±0.01c | 1.04±0.01b | 16.98 |
Beak index | 1.88±0.02c | 2.26±0.02a | 1.97±0.03 b | 17.81 |
Spur length (cm) | 1.43±0.01a | 0.93±0.01 c | 1.14±0.01b | 13.48 |
Wing span (cm) | 41.79±0.10a | 37.20± 0.10b | 34.81±0.12c | 4.31 |
Traits | Agro-climatic zones | ||||||
|---|---|---|---|---|---|---|---|
Sex of chicken | Kolla (N = 310) | Weynadega (N = 260) | Dega (N = 200) | Total | Overall (N = 770) | CV | |
Body length (cm) | Male | 39.53 ± 0.09a | 36.08 ± 0.10b | 32.50± 0.12c | 36.04±0.06 a | 30.18±0.04 | 3.72 |
Female | 24.23 ±0.09e | 24.92±0.09d | 23.82±0.11 f | 24.32±0.06 b | |||
Body wt(gm) | Male | 1.676±0.01a | 1.579±0.01b | 1.451±0.01c | 1.569±0.004a | 1.415±0.003 | 5.34 |
Female | 1.272±0.01d | 1.270±0.01d | 1.192±0.01e | 1.261±0.004b | |||
Shank length (cm) | Male | 12.93 ±0.05a | 10.81±0.06b | 9.87±0.06c | 11.20± 0.03a | 9.83±0.023 | 6.24 |
Female | 8.81±0.05c | 8.29±0.05e | 8.27 ±0.06e | 8.46± 0.03b | |||
Comb length (cm) | Male | 7.50 ±0.04a | 6.68±0.04b | 5.49 ±0.05c | 6.55±0.02a | 4.62±0.02 | 10.1 |
Female | 2.73±0.03d | 2.57±0.04e | 2.78 ±0.04d | 2.69± 0.02b | |||
Comb width(cm) | Male | 3.81 ±0.02a | 2.75 ±0.02c | 3.09±0.02b | 3.22±0.01a | 2.35±0.01 | 9.47 |
Female | 1.47 ±0.02d | 1.51±0.02d | 1.47 ±0.02d | 1.48±0.01b | |||
Comb index | Male | 1.98 ±0.02b | 2.44 ±0.02a | 1.78 ±0.03de | 2.07± 0.01a | 1.95±0.01 | 13.22 |
Female | 1.87±0.02cd | 1.71 ±0.02e | 1.89±0.02bc | 1.83±0.01b | |||
Earlobe length (cm) | Male | 3.55 ±0.01a | 2.53 ±0.02c | 3.06 ±0.02b | 3.05±0.01a | 2.32±0.01 | 7.85 |
Female | 1.63±0.01 e | 1.27±0.01f | 1.88±0.02d | 1.59±0.01b | |||
Earlobe width(cm) | Male | 2.19±0.02 a | 1.32 ±0.02c | 1.86 ±0.02b | 1.79± 0.01a | 1.37±0.01 | 13.92 |
Female | 0.91 ±0.01e | 0.71 ±0.02f | 1.23±0.02 d | 0.95±0.01b | |||
Earlobe index | Male | 1.64±0.02c | 1.96± 0.03a | 1.66 ±0.02c | 1.75± 0.01a | 1.75±0.01 | 15.65 |
Female | 1.84 ±0.02b | 1.8 4 ±0.02b | 1.57 ±0.03c | 1.75±0.01a | |||
Wattle length (cm) | Male | 6.21± 0.05a | 4.46 ±0.06c | 5.30 ±0.06b | 5.32±0.03a | 3.67±0.02 | 16.83 |
Female | 2.12 ±0.05d | 2.02 ±0.05d | 2.08± 0.06d | 2.07 ±0.03b | |||
Wattle width(cm) | Male | 3.93± 0.04a | 2.77 ±0.04c | 3.37±0.05b | 3.36±0.03a | 2.32±0.02 | 21.69 |
Female | 1.38±0.04d | 1.08±0.04e | 1.39±0.05d | 1.28±0.02b | |||
Wattle index | Male | 1.61±0.02bc | 1.71 ±0.03b | 1.66 ±0.04b | 1.66±0.02b | 1.69±0.01 | 20.82 |
Female | 1.61± 0.03bc | 2.02 ±0.03a | 1.52 ±0.05c | 1.71±0.02a | |||
Traits | Agro-climatic zones | ||||||
|---|---|---|---|---|---|---|---|
Sex of chicken | Kolla (N = 310) | Weynadega (N = 260) | Dega (N = 200) | Total | Overall (N = 770) | CV | |
Skull length(cm) | Male | 6.63 ±0.07b | 7.04 ±0.08a | 6.63± 0.09b | 6.77±0.04a | 6.46±0.03 | 12.91 |
Female | 5.78 ±0.06d | 6.27 ±0.07c | 6.38 ±0.08bc | 6.15± 0.04b | |||
Skull width(cm) | Male | 4.18 ±0.05a | 4.18 ±0.06 a | 3.87 ±0.07b | 4.08±0.03a | 3.79±0.02 | 16.57 |
Female | 3.41 ±0.05c | 3.51±0.05c | 3.59 ±0.06c | 3.50±0.03b | |||
Skull index | Male | 1.64 ±0.02 c | 1.72± 0.02bc | 1.73 ±0.03abc | 1.70±0.01b | 1.75±0.01 | 14.54 |
Female | 1.76 ± 0.02ab | 1.82±0.02 a | 1.80 ±0.02ab | 1.8±0.01a | |||
Neck length(cm) | Male | 15.70 ± 0.07b | 16.93 ±0.08a | 13.70± 0.09c | 15.44± 0.05a | 14.30±0.03 | 6.30 |
Female | 13.73±0.07c | 13.61±0.08c | 12.15 ±0.09c | 13.16± 0.05b | |||
Beak length(cm) | Male | 2.23± 0.02a | 2.07± 0.02b | 1.99 ±0.02c | 2.10±0.01a | 2.07±0.01 | 9.29 |
Female | 2.03 ±0.02bc | 2.06±0.02b | 2.06 ±0.02bc | 2.05±0.01b | |||
Beak width(cm) | Male | 1.24± 0.01a | 0.97± 0.02cd | 1.04 ±0.02bc | 1.08±0.10a | 1.05±0.01 | 16.98 |
Female | 1.08 ± 0.01b | 0.93 ±0.02d | 1.03 ±0.02bc | 1.01±0.01b | |||
Beak index | Male | 1.80± 0.03d | 2.17 ± 0.03b | 1.93 ±0.04cd | 1.97±0.02b | 2.04±0.01 | 17.81 |
Female | 1.97 ±0.03c | 2.35± 0.03a | 2.01 ±0.03c | 2.11±0.02 a | |||
Spur length(cm) | Male | 2.44 ±0.01a | 1.48 ±0.01c | 1.87 ±0.02b | 1.93± 0.01a | 1.17±0.01 | 13.48 |
Female | 0.42 ±0.01d | 0.37 ±0.01d | 0.41± 0.01d | 0.40 0.01b | |||
Wing span(cm) | Male | 47.52 ±0.14a | 40.01 ±0.15b | 36.80 ±0.18c | 41.44± 0.09a | 37.93±0.06 | 4.41 |
Female | 36.05±0.13d | 34.39±0.14e | 32.83±0.16f | 34.42±0.08b | |||
Bl | Shl | Cbl | Cbw | Cbx | Erl | Erw | Erx | Wal | Waw | |
|---|---|---|---|---|---|---|---|---|---|---|
Kolla | ||||||||||
Bwt | 0.29*** | 0.43*** | 0.45*** | 0.36*** | 0.06 | 0.48*** | 0.46*** | -0.06 | 0.42*** | 0.40*** |
Bl | 1.00 | 0.22** | 0.34** | 0.23** | 0.06 | 0.16 | 0.17 | -0.07 | 0.16 | 0.14 |
Shl | 1.00 | 0.36*** | 0.31*** | 0.03 | 0.26** | 0.49*** | -0.47*** | 0.30*** | 0.37*** | |
Cbl | 1.00 | 0.86*** | -0.05 | 0.60*** | 0.53*** | -0.12 | 0.76*** | 0.71*** | ||
Cbw | 1.00 | -0.49*** | -0.58*** | 0.48*** | -0.09 | 0.65*** | 0.67*** | |||
Cbx | 1.00 | -0.08 | -0.07 | 0.07 | -0.02 | -0.10 | ||||
Erl | 1.00 | 0.80*** | 0.01 | 0.72*** | 0.68*** | |||||
Erw | 1.00 | 0.54*** | 0.66*** | 0.62*** | ||||||
Erx | 1.00 | -0.15 | -0.16 | |||||||
Wal | 1.00 | 0.91*** | ||||||||
Waw | 1.00 | |||||||||
Wax | ||||||||||
Skl | ||||||||||
Skw | ||||||||||
Skx | ||||||||||
Nel | ||||||||||
Bel | ||||||||||
Bew | ||||||||||
Bex | ||||||||||
Spl | ||||||||||
Weynadega | ||||||||||
Bwt | 0.21* | 0.19* | 0.05 | 0.11 | -0.10 | 0.18 | 0.17 | -0.10 | 0.20* | 0.15 |
Bl | 1.00 | 0.27** | -0.09 | 0.01 | -0.14 | 0.06 | 0.07 | 0.06 | 0.05 | -0.02 |
Shl | 1.00 | 0.29** | 0.33** | -0.05 | 0.45*** | 0.39*** | -0.15 | 0.47*** | 0.52*** | |
Cbl | 1.00 | 0.86*** | 0.05 | 0.66*** | 0.64*** | -0.28** | 0.73*** | 0.63*** | ||
Cbw | 1.00 | -0.43*** | 0.59*** | 0.60*** | 0.20* | 0.65*** | 0.56*** | |||
Cbx | 1.00 | -0.02 | -0.07 | -0.11 | 0.02 | 0.02 | ||||
Erl | 1.00 | 0.91*** | -0.29** | 0.72*** | 0.72*** | |||||
Erw | 1.00 | -0.35*** | 0.71*** | 0.70*** | ||||||
Erx | 1.00 | -0.25** | -0.22** | |||||||
Wal | 1.00 | 0.91*** | ||||||||
Waw | 1.00 | |||||||||
Wax | ||||||||||
Skl | ||||||||||
Skw | ||||||||||
Skx | ||||||||||
Nel | ||||||||||
Bel | ||||||||||
Bew | ||||||||||
Bex | ||||||||||
Spl |
Wax | Skl | Skw | Skx | Nel | Bel | Bew | Bex | Spl | Wn | |
|---|---|---|---|---|---|---|---|---|---|---|
Kolla | ||||||||||
Bwt | 0.01 | 0.51*** | 0.42*** | -0.07 | -0.17 | 0.21* | -0.19* | 0.31*** | 0.66*** | 0.38*** |
Bl | 0.03 | 0.32*** | 0.26** | -0.12 | 0.17 | 0.07 | -0.09 | 0.13 | 0.23** | 0.45*** |
Shl | -0.31*** | 0.40*** | 0.19* | 0.04 | -0.65*** | 0.23** | -0.02 | 0.14 | 0.58*** | 0.10 |
Cbl | 0.07 | 0.55*** | 0.63*** | -0.30*** | 0.003 | 0.36*** | -0.11 | 0.28*** | 0.62*** | 0.47*** |
Cbw | -0.06 | 0.50*** | 0.65*** | -0.36*** | 0.02 | 0.36*** | -0.03 | 0.21* | 0.55*** | 0.31*** |
Cbx | 0.14 | -0.04 | -0.17 | 0.20* | -0.05 | -0.09 | 0.22* | 0.17 | -0.06 | 0.13 |
Erl | 0.09 | 0.66*** | 0.72*** | -0.31*** | -0.07 | 0.38*** | -0.14 | 0.36*** | 0.58*** | 0.42*** |
Erw | 0.02 | 0.55*** | 0.49*** | -0.19* | -0.26** | 0.30*** | 0.04 | 0.12 | 0.61*** | 0.45*** |
Erx | 0.12 | -0.04 | 0.14 | -0.05 | 0.35*** | -0.03 | -0.26** | 0.26** | -0.22** | -0.05 |
Wal | 0.16 | 0.58*** | 0.61*** | -0.26** | 0.02 | 0.34*** | -0.07 | 0.24** | 0.59*** | 0.47*** |
Waw | 0.24** | 0.52*** | 0.57*** | -0.27** | -0.13 | 0.27*** | -0.08 | 0.23** | 0.62*** | 0.32*** |
Wax | 1.00 | 0.13 | 0.08 | 0.03 | 0.41*** | 0.13 | 0.02 | 0.02 | -0.14 | 0.30*** |
Skl | 1.00 | 0.81*** | -0.25** | -0.12 | 0.48*** | -0.23** | 0.49*** | 0.52*** | 0.48*** | |
Skw | 1.00 | -0.52*** | 0.06 | 0.44*** | -0.24** | 0.48*** | 0.46*** | 0.44*** | ||
Skx | 1.00 | -0.14 | -0.15 | 0.10 | -0.18 | -0.16 | -0.15 | |||
Nel | 1.00 | -0.13 | 0.07 | -0.17 | -0.33*** | 0.37*** | ||||
Bel | 1.00 | 0.20* | 0.34*** | 0.39*** | 0.25** | |||||
Bew | 1.00 | -0.83*** | -0.10 | 0.05 | ||||||
Bex | 1.00 | 0.31*** | 0.06 | |||||||
Spl | 1.00 | 0.38*** | ||||||||
Weynadega | ||||||||||
Bwt | 0.04 | 0.25** | 0.26** | -0.10 | 0.13 | 0.13 | 0.10 | -0.05 | 0.24** | 0.28** |
Bl | 0.15 | 0.48*** | 0.46*** | -0.12 | 0.67*** | 0.09 | 0.01 | 0.04 | 0.08 | 0.25** |
Shl | -0.32*** | 0.46*** | 0.49*** | -0.17 | 0.12 | 0.21* | 0.16 | -0.08 | 0.33*** | 0.45*** |
Cbl | 0.03 | 0.20* | 0.24** | -0.15 | 0.21* | 0.05 | 0.13 | -0.14 | 0.63*** | 0.17 |
Cbw | 0.02 | 0.27** | 0.29** | -0.15 | -0.13 | -0.03 | 0.03 | -0.09 | 0.65*** | 0.21* |
Cbx | 0.04 | -0.13 | -0.11 | 0.02 | -0.08 | 0.14 | 0.16 | -0.08 | -0.19* | -0.06 |
Erl | -0.17 | 0.33*** | 0.33*** | -0.11 | -0.19* | 0.21* | 0.34*** | 0.30*** | 0.63*** | 0.39*** |
Erw | -0.17 | 0.28** | 0.26** | -0.05 | -0.24** | 0.17 | 0.26** | -0.25** | 0.66*** | 0.40*** |
Erx | -0.02 | -0.03 | -0.05 | -0.03 | 0.14 | -0.12 | -0.13 | 0.09 | -0.18* | -0.14 |
Wal | -0.11 | 0.35*** | 0.39*** | -0.19* | -0.06 | 0.13 | 0.13 | -0.08 | 0.66*** | 0.40*** |
Waw | -0.46*** | 0.31*** | 0.36*** | -0.15 | -0.13 | 0.12 | 0.12 | -0.08 | 0.58*** | 0.43*** |
Wax | 1.00 | 0.04 | -0.02 | -0.03 | 0.24** | -0.01 | 0.07 | -0.10 | -0.003 | 0.25** |
Skl | 1.00 | 0.79*** | -0.12 | 0.49*** | 0.33*** | 0.39*** | -0.23* | 0.28** | 0.45*** | |
Skw | 1.00 | -0.57*** | 0.41*** | 0.36*** | 0.34*** | -0.19* | 0.30*** | 0.37*** | ||
Skx | 1.00 | -0.08 | -0.07 | -0.03 | 0.03 | -0.17 | -0.02 | |||
Nel | 1.00 | 0.002 | -0.09 | 0.16 | -0.13 | 0.24* | ||||
Bel | 1.00 | 0.60*** | -0.03 | 0.20* | 0.10 | |||||
Bew | 1.00 | -0.79*** | 0.21* | 0.17 | ||||||
Bex | 1.00 | -0.13 | -0.11 | |||||||
Spl | 1.00 | 0.27** |
Bl | Shl | Cbl | Cbw | Cbx | Erl | Erw | Erx | Wal | Waw | |
|---|---|---|---|---|---|---|---|---|---|---|
Dega | ||||||||||
Bwt | 0.15 | 0.12 | 0.31** | 0.30** | -0.07 | 0.12 | 0.24* | -0.16 | 0.22* | 0.19* |
Bl | 1.00 | 0.69*** | 0.21* | 0.39*** | -0.30** | 0.61*** | 0.31** | 0.20* | 0.27** | 0.13 |
Shl | 1.00 | 0.07 | 0.28** | -0.31** | 0.53*** | 0.23* | 0.24* | 0.16 | 0.002 | |
Cbl | 1.00 | 0.70*** | 0.17 | 0.19* | 0.42*** | -0.34*** | 0.66*** | 0.66*** | ||
Cbw | 1.00 | -0.49*** | 0.40*** | 0.52*** | -0.27** | 0.52*** | 0.54*** | |||
Cbx | 1.00 | -0.39*** | -0.25* | -0.04 | 0.03 | 0.01 | ||||
Erl | 1.00 | 0.63*** | 0.15 | 0.37*** | 0.23* | |||||
Erw | 1.00 | 0.66*** | 0.35*** | 0.50*** | ||||||
Erx | 1.00 | -0.10 | -0.39*** | |||||||
Wal | 1.00 | 0.84*** | ||||||||
Waw | 1.00 | |||||||||
Wax | ||||||||||
Skl | ||||||||||
Skw | ||||||||||
Skx | ||||||||||
Nel | ||||||||||
Bel | ||||||||||
Bew | ||||||||||
Bex | ||||||||||
Spl |
Wax | Skl | Skw | Skx | Nel | Bel | Bew | Bex | Spl | Wn | |
|---|---|---|---|---|---|---|---|---|---|---|
Dega | ||||||||||
Bwt | -0.001 | -0.01 | -0.09 | 0.03 | -0.04 | 0.11 | -0.03 | 0.11 | 0.16 | -0.04 |
Bl | 0.18 | 0.77*** | 0.39*** | 0.21* | 0.21* | -0.002 | -0.02 | 0.03 | 0.58*** | 0.63*** |
Shl | 0.25* | 0.60*** | 0.24* | 0.26* | 0.02 | 0.09 | -0.09 | 0.18 | 0.22* | 0.63*** |
Cbl | -0.24* | -0.07 | -0.09 | 0.003 | 0.32** | 0.03 | 0.07 | -0.06 | 0.28** | 0.12 |
Cbw | -0.24* | 0.12 | 0.06 | -0.003 | 0.26* | -0.11 | -0.13 | 0.09 | 0.44*** | 0.15 |
Cbx | 0.06 | -0.28** | -0.18 | 0.001 | 0.07 | 0.23* | 0.26* | -0.17 | -0.26* | -0.11 |
Erl | 0.11 | 0.70*** | 0.41*** | 0.14 | 0.12 | -0.08 | -0.07 | 0.04 | 0.45*** | 0.44*** |
Erw | -0.41*** | 0.36*** | 0.21* | 0.16 | 0.10 | -0.13 | -0.25* | 0.21* | 0.15 | 0.14 |
Erx | 0.61*** | 0.23* | 0.12 | -0.03 | -0.01 | 0.08 | 0.26* | -0.25* | 0.18 | 0.27** |
Wal | -0.06 | 0.12 | 0.09 | 0.02 | 0.31** | 0.07 | 0.07 | -0.04 | 0.32** | 0.20* |
Waw | -0.58*** | 0.01 | 0.02 | 0.03 | 0.23* | -0.04 | -0.09 | 0.08 | 0.14 | 0.04 |
Wax | 1.00 | 0.18 | 0.06 | -0.03 | 0.05 | 0.18 | 0.27** | -0.18 | 0.19 | 0.27** |
Skl | 1.00 | 0.63*** | 0.18 | 0.05 | 0.04 | -0.05 | 0.09 | 0.37*** | 0.59*** | |
Skw | 1.00 | -0.38*** | 0.08 | 0.006 | 0.09 | -0.11 | 0.31** | 0.24* | ||
Skx | 1.00 | -0.18 | 0.05 | -0.03 | 0.11 | -0.08 | 0.08 | |||
Nel | 1.00 | 0.11 | 0.02 | 0.04 | 0.21* | 0.16 | ||||
Bel | 1.00 | 0.54*** | -0.004 | 0.002 | 0.10 | |||||
Bew | 1.00 | -0.84*** | 0.04 | 0.08 | ||||||
Bex | 1.00 | -0.05 | 0.21* | |||||||
Spl | 1.00 | 0.26* |
Bl | Shl | Cbl | Cbw | Cbx | Erl | Erw | Erx | Wal | Waw | |
|---|---|---|---|---|---|---|---|---|---|---|
Kolla | ||||||||||
Bwt | -0.07 | 0.18 | 0.45*** | 0.33*** | 0.02 | 0.27*** | 0.29*** | 0.05 | 0.22** | 0.28*** |
Bl | 1.00 | -0.10 | 0.13 | 0.01 | 0.08 | -0.002 | -0.06 | 0.05 | -0.01 | -0.05 |
Shl | 1.00 | 0.23** | 0.34*** | -0.28*** | 0.58*** | 0.44*** | -0.05 | 0.52*** | 0.51*** | |
Cbl | 1.00 | 0.80*** | -0.01 | 0.36*** | 0.35*** | -0.15 | 0.45*** | 0.46*** | ||
Cbw | 1.00 | -0.58*** | 0.54*** | 0.44*** | -0.13 | 0.57*** | 0.59*** | |||
Cbx | 1.00 | -0.42*** | -0.29*** | 0.06 | -0.36*** | -0.39*** | ||||
Erl | 1.00 | 0.78*** | -0.19* | 0.69*** | 0.76*** | |||||
Erw | 1.00 | -0.61*** | 0.59*** | 0.69*** | ||||||
Erx | 1.00 | -0.15 | -0.24** | |||||||
Wal | 1.00 | 0.86*** | ||||||||
Waw | 1.00 | |||||||||
Wax | ||||||||||
Skl | ||||||||||
Skw | ||||||||||
Skx | ||||||||||
Nel | ||||||||||
Bel | ||||||||||
Bew | ||||||||||
Bex | ||||||||||
Spl | ||||||||||
Weynadega | ||||||||||
Bwt | -0.08 | -0.08 | 0.23** | 0.10 | 0.18 | 0.13 | 0.16 | 0.16 | 0.28*** | 0.18 |
Bl | 1.00 | -0.04 | -0.15 | -0.12 | -0.03 | 0.03 | 0.07 | -0.10 | 0.02 | 0.16 |
Shl | 1.00 | 0.18 | 0.14 | 0.05 | 0.24** | 0.18 | 0.06 | 0.19* | 0.22** | |
Cbl | 1.00 | 0.61*** | 0.51*** | 0.36*** | 0.36*** | 0.20* | 0.47*** | 0.40*** | ||
Cbw | 1.00 | -0.36*** | -0.005 | -0.06 | -0.01 | 0.13 | 0.06 | |||
Cbx | 1.00 | 0.42*** | 0.46*** | 0.24** | 0.42*** | 0.41*** | ||||
Erl | 1.00 | 0.83*** | 0.22** | 0.54*** | 0.62*** | |||||
Erw | 1.00 | 0.23** | 0.53*** | 0.68*** | ||||||
Erx | 1.00 | 0.13 | 0.15 | |||||||
Wal | 1.00 | 0.87*** | ||||||||
Waw | 1.00 | |||||||||
Wax | ||||||||||
Skl | ||||||||||
Skw | ||||||||||
Skx | ||||||||||
Nel | ||||||||||
Bel | ||||||||||
Bew | ||||||||||
Bex | ||||||||||
Spl |
Wax | Skl | Skw | Skx | Nel | Bel | Bew | Bex | Spl | Wn | |
|---|---|---|---|---|---|---|---|---|---|---|
Kolla | ||||||||||
Bwt | -0.20** | 0.28*** | 0.29*** | -0.18 | 0.06 | -0.01 | -0.16 | 0.10 | 0.21** | 0.21** |
Bl | 0.06 | 0.18 | 0.18 | -0.19* | 0.19* | -0.09 | -0.15 | 0.08 | -0.02 | 0.32*** |
Shl | -0.31*** | 0.45*** | 0.31*** | -0.04 | -0.41*** | 0.56*** | 0.18 | 0.15 | 0.46*** | -0.04 |
Cbl | -0.22** | 0.25** | 0.24** | -0.22** | 0.11 | 0.18 | -0.20* | 0.25** | 0.24** | 0.05 |
Cbw | -0.32*** | 0.30*** | 0.28*** | -0.20* | -0.11 | 0.37*** | 0.05 | 0.07 | 0.30*** | 0.05 |
Cbx | 0.30*** | -0.21** | -0.16 | 0.03 | 0.40*** | -0.38*** | -0.36*** | 0.07 | -0.20** | 0.02 |
Erl | -0.47*** | 0.63*** | 0.55*** | -0.24** | -0.44*** | 0.62*** | 0.24** | 0.12 | 0.55*** | 0.07 |
Erw | -0.42*** | 0.57*** | 0.36*** | -0.02 | -0.38*** | 0.53*** | 0.20* | 0.11 | 0.40*** | -0.09 |
Erx | 0.19* | -0.14 | 0.05 | -0.18 | 0.18 | -0.16 | -0.02 | -0.09 | -0.01 | 0.11 |
Wal | -0.30*** | 0.46*** | 0.43*** | -0.17 | -0.19* | 0.44*** | 0.23** | 0.02 | 0.39*** | 0.03 |
Waw | -0.68*** | 0.59*** | 0.50*** | -0.19* | -0.32*** | 0.52*** | 0.18 | 0.11 | 0.34*** | -0.04 |
Wax | 1.00 | -0.44*** | -0.34*** | 0.10 | 0.38*** | -0.37*** | -0.10 | -0.10 | -0.16 | 0.14 |
Skl | 1.00 | 0.77*** | -0.34*** | -0.24** | 0.43*** | 0.15 | 0.08 | 0.42*** | 0.18 | |
Skw | 1.00 | -0.77*** | -0.05 | 0.24** | 0.07 | 0.09 | 0.48*** | 0.26** | ||
Skx | 1.00 | -0.19* | 0.08 | 0.07 | -0.06 | -0.27*** | -0.32*** | |||
Nel | 1.00 | -0.55*** | -0.35*** | 0.02 | -0.35*** | 0.39*** | ||||
Bel | 1.00 | 0.36*** | 0.24** | 0.47*** | -0.19* | |||||
Bew | 1.00 | -0.72*** | 0.16 | -0.15 | ||||||
Bex | 1.00 | 0.16 | 0.02 | |||||||
Spl | 1.00 | -0.03 | ||||||||
Weynadega | ||||||||||
Bwt | 0.20* | -0.16 | -0.16 | 0.11 | -0.03 | -0.09 | -0.04 | 0.03 | 0.15 | 0.01 |
Bl | -0.25** | 0.31*** | 0.37*** | -0.19* | 0.01 | 0.11 | 0.12 | -0.05 | 0.06 | 0.31*** |
Shl | -0.14 | 0.39*** | 0.34*** | -0.12 | 0.11 | 0.40*** | 0.35*** | -0.20* | 0.16 | 0.32*** |
Cbl | -0.01 | -0.02 | -0.01 | -0.04 | -0.15 | 0.07 | 0.10 | -0.06 | 0.30*** | -0.03 |
Cbw | 0.05 | 0.03 | 0.04 | -0.03 | 0.09 | -0.05 | -0.01 | 0.02 | 0.13 | 0.12 |
Cbx | -0.08 | -0.05 | -0.05 | -0.01 | -0.25** | 0.13 | 0.11 | -0.07 | 0.20* | -0.16 |
Erl | -0.24** | 0.04 | -0.002 | 0.04 | -0.52*** | 0.26** | 0.45*** | -0.39*** | 0.39*** | -0.06 |
Erw | -0.28*** | 0.14 | 0.11 | -0.04 | -0.51*** | 0.20* | 0.39*** | -0.34*** | 0.52*** | 0.04 |
Erx | 0.0005 | -0.07 | -0.10 | 0.03 | -0.18 | -0.06 | 0.04 | -0.09 | 0.04 | 0.03 |
Wal | 0.04 | 0.14 | 0.18 | -0.15 | 0.22** | 0.11 | 0.18 | -0.12 | 0.41*** | 0.07 |
Waw | -0.42*** | 0.27** | 0.28** | -0.16 | -0.34*** | 0.21* | 0.30*** | -0.24** | 0.51*** | 0.19* |
Wax | 1.00 | -0.26** | -0.20* | 0.06 | 0.22** | -0.23** | -0.26** | 0.19* | -0.18 | -0.21* |
Skl | 1.00 | 0.77*** | -0.25** | 0.23** | 0.32*** | 0.25** | -0.08 | 0.35*** | 0.60*** | |
Skw | 1.00 | -0.72*** | 0.22** | 0.28*** | 0.18 | -0.03 | 0.22* | 0.67*** | ||
Skx | 1.00 | -0.06 | -0.14 | -0.07 | 0.01 | -0.03 | -0.42*** | |||
Nel | 1.00 | 0.02 | -0.33*** | 0.51*** | -0.21* | 0.24** | ||||
Bel | 1.00 | 0.60*** | -0.13 | 0.20* | 0.08 | |||||
Bew | 1.00 | -0.81*** | 0.30*** | 0.13 | ||||||
Bex | 1.00 | -0.22* | -0.05 | |||||||
Spl | 1.00 | 0.11 |
Bl | Shl | Cbl | Cbw | Cbx | Erl | Erw | Erx | Wal | Waw | |
|---|---|---|---|---|---|---|---|---|---|---|
Dega | ||||||||||
Bwt | -0.04 | 0.28** | 0.22* | 0.09 | 0.18 | 0.09 | 0.11 | -0.09 | 0.09 | 0.10 |
Bl | 1.00 | -0.11 | 0.04 | 0.07 | -0.11 | 0.18 | 0.05 | 0.10 | -0.003 | -0.003 |
Shl | 1.00 | 0.09 | 0.002 | 0.06 | 0.07 | 0.20* | -0.15 | -0.09 | -0.042 | |
Cbl | 1.00 | 0.71*** | 0.11 | 0.34*** | 0.30** | -0.04 | 0.57*** | 0.59*** | ||
Cbw | 1.00 | -0.58*** | 0.32*** | 0.14 | 0.17 | 0.51*** | 0.52*** | |||
Cbx | 1.00 | -0.22* | 0.03 | -0.27** | -0.10 | -0.10 | ||||
Erl | 1.00 | 0.54*** | 0.09 | 0.19* | 0.23* | |||||
Erw | 1.00 | -0.74*** | 0.35*** | 0.39*** | ||||||
Erx | 1.00 | -0.16 | -0.15 | |||||||
Wal | 1.00 | 0.90*** | ||||||||
Waw | 1.00 | |||||||||
Wax | ||||||||||
Skl | ||||||||||
Skw | ||||||||||
Skx | ||||||||||
Nel | ||||||||||
Bel | ||||||||||
Bew | ||||||||||
Bex | ||||||||||
Spl |
Wax | Skl | Skw | Skx | Nel | Bel | Bew | Bex | Spl | Wn | |
|---|---|---|---|---|---|---|---|---|---|---|
Dega | ||||||||||
Bwt | -0.03 | -0.13 | -0.11 | 0.04 | -0.01 | 0.08 | -0.01 | 0.08 | 0.18 | 0.18 |
Bl | -0.03 | 28** | 0.10 | 0.14 | 0.04 | 0.05 | 0.002 | 0.05 | 0.06 | 0.15 |
Shl | -0.10 | 0.22* | 0.26** | -0.05 | 0.03 | 0.01 | 0.27 | -0.05 | 0.056 | 0.40*** |
Cbl | -0.05 | -0.23* | -0.29** | 0.02 | 0.08 | -0.07 | -0.05 | -0.05 | 0.04 | -0.15 |
Cbw | -0.03 | -0.07 | -0.16 | -0.002 | 0.07 | 0.07 | -0.01 | 0.07 | 0.002 | -0.13 |
Cbx | -0.02 | -0.25** | -0.15 | 0.12 | 0.003 | -0.14 | -0.09 | -0.12 | -0.01 | 0.02 |
Erl | -0.09 | 0.39*** | 0.09 | -0.08 | 0.13 | 0.03 | 0.08 | -0.05 | 0.13 | 0.12 |
Erw | -0.10 | 0.20* | 0.05 | -0.04 | 0.20* | -0.09 | 0.11 | -0.10 | -0.01 | 0.17 |
Erx | 0.01 | 0.05 | -0.01 | -0.01 | -0.21* | 0.07 | -0.07 | 0.07 | 0.04 | -0.14 |
Wal | 0.16 | -0.35*** | -0.29** | 0.03 | 0.10 | -0.06 | -0.04 | -0.05 | -0.15 | -0.20* |
Waw | -0.27** | -0.27** | -0.35*** | 0.11 | 0.11 | -0.01 | -0.06 | 0.01 | -0.16 | -0.16 |
Wax | 1.00 | -0.21* | 0.12 | -0.25** | -0.12 | -0.13 | 0.05 | -0.14 | -0.01 | -0.16 |
Skl | 1.00 | 0.61*** | -0.06 | 0.16 | 0.08 | 0.19 | 0.04 | 0.08 | 0.46*** | |
Skw | 1.00 | -0.56*** | -0.11 | -0.12 | 0.29** | -0.18 | 0.09 | 0.30** | ||
Skx | 1.00 | 0.25** | 0.15 | -0.25** | 0.20* | -0.17 | -0.07 | |||
Nel | 1.00 | 0.04 | -0.12 | 0.06 | 0.30** | 0.38*** | ||||
Bel | 1.00 | 0.01 | 0.98*** | -0.10 | -0.05 | |||||
Bew | 1.00 | -0.19* | -0.06 | 0.12 | ||||||
Bex | 1.00 | -0.08 | -0.07 | |||||||
Spl | 1.00 | 0.38*** |
CSA | Centeral Statistical Agency |
Cm | Centimeter |
EARO | Ethiopian Agricultural Research Organization |
FAO | Food and Agriculture Organization |
Masl | Meter Above Sea Level |
Mm | Millimeter |
PROC GLM | General Linear Model Procedure |
| [1] |
The Economist. 2011. FAO Statistics data Global-Livestock -counts. Retrived from web site:
http://www.economist.com/blogs/dailychart/2011/07/global-livestock-counts |
| [2] | FAO. 2012a. GLOBAL POULTRY TRENDS 2012. Reterived from web site: |
| [3] | Alders RG, Pym RAE. 2009. Village Poultry: Still Important to Millions, Eight Thousand Years after Domestication. World Poultry Sci J. 65: 181–190. |
| [4] | Fayeye, T. R., Ayorinde, K. L., Ojo, V. and Adensina, O. M. 2006. Frequency and Influence of some major Genes on body weight and body size parameters of Nigerian local Chickens. Livestock Research Rural Development. Vol. 8. |
| [5] | Gueye, E. F. 1998. Village Egg and Fowl Meat Production in Africa. World Poultry Sci J, 54: 73–86. |
| [6] | Gueye, E. F. 2002. Employment and Income Generation through Family Poultry in Low-Income Food-Deficit Countries. World Poultry Sci J., 58: 541–557. |
| [7] | Aboe, P., Boa-Amponsem, K., Okantah, S., Dorward, P. & Bryant, M. 2006. Free-Range Village Chickens on the Accra Plains, Ghana: Their Contribution to Households. Trop Anim Health Prod, 38: 223–234. |
| [8] | Faustin, V., Adégbidi, V. F., Garnett, S. T., Koudandé, D. O., Agbo, V. & Zander, K. K. 2010. Peace, Health or Fortune? Preferences for Chicken Traits in Rural Benin. Ecol Econ, 69: 1848–1857. |
| [9] | Abdelqader, A., Wollny, C. B. A. & Gauly, M. 2007. Characterization of Local Chicken Production Systems and their Potential under Different Levels of Management Practice in Jordan. Tropical Animal Health and Production, 39(3): 155–164. |
| [10] | Aklilu, H., Almekinders, C. J. M. and Vander, A. J. Z. 2007. Village Poultry Consumption and Marketing in relation to Gender, Religious Festivals and Market Access, Tropical animal health and Production, 39: 165-168. |
| [11] | Besbes, B. 2009. Genotype Evaluation and Breeding of Poultry for Performance under Suboptimal Village Conditions, World poultry Science Journal, 65: 260-271. |
| [12] | Minga, U. M., Msoffe, P. L. and Gwakisa, P. S. 2004. Biodiversity (Variation) in disease resistance and in pathogens with in rural chickens. Proceeding of the 22nd World Poultry Congress, Istanbul, Turkey. |
| [13] | CSA (Central Statistical Agency). 2021. Agricultural Sample Survey 2020/21. Statistical Bulletin II: 589 Report on Livestock and Livestock Characteristics, Addis Ababa. |
| [14] | CSA (Central Statistical Agency). 2011. Agricultural Sample Survey 2010/11. Statistical Bulletin 2: 505 Report on Livestock and Livestock Characteristics, Addis Ababa. |
| [15] | Pagani, P. & Abebe, W. 2008. Review of the new features of the Ethiopian poultry sector Biosecurity implications. Food and Agriculture Organizations of the United Nations. Pp3-4. |
| [16] | FAO. 2012b. Phenotypic Characterization of Animal Genetic Resources. FAO Animal Production and Health Guidelines No. 11. Rome. |
| [17] | Humphreys, M. O. 1991. A Genetic Approach to the Multivariate Differentiation of Perennial Ryegrass (Lolium PerenneL.) Cultivars. Heredity. 66: 437-443. |
| [18] | Dana, N., J. A. M. VanArendonk, L. H. Vander Waaij and T. Dessie. 2010. Production Objectives and Trait Preferences of Village Poultry Producers of Ethiopia: Implications for Designing Breeding Schemes Utilizing Indigenous Chicken Genetic Resources. Trop Anim Health Prod., 42: 1519-1529. |
| [19] | Chencha, C. and Hailemikael, N. 2016. Performances, Breeding Practices and Trait Preferences of Local Chicken Ecotypes in Southern zone of Tigray, Northern Ethiopia. Asian J. Poult. Sci., 10: 158-164. |
| [20] | Assefa, H., and Melesse, A. 2018. Morphological and Morphometric Characterization of Indigenous Chicken Populations in Sheka Zone, South Western Ethiopia. Poult Fish Wildl Sci., 6(2): 1-9. |
| [21] | Tareke, M., Assefa, B., Abate, T. & Tekletsadik. E. 2018. Evaluation of Morphometric Differences among Indigenous Chicken Populations in Bale Zone, Oromia Regional State, Ethiopia. Poult. Sci. J. 6(2): 181-190. |
| [22] | Dana, N., J. A. M. VanArendonk and L. H. Vander Waaij. 2011. Genetic and Phenotypic Parameter Estimates for Body weight and Egg production in Horro Chicken of Ethiopia. Trop Anim Health Prod., 43: 21-28. |
| [23] | Mekonnen, H., Kalayou, S., Kyule, M., Asfaha, M., & Belihu, K. 2011. Effect of Brucella Infection on Reproduction Conditions of Female Breeding Cattle and Its Public Health Significance in Western Tigray, Northern Ethiopia. Veterinary medicine international. 354943. |
| [24] | EARO (Ethiopian Agricultural Research Organization). 2000. Summary of livestock research strategies. Animal science Directorate, EARO, Addis Ababa, Ethiopia. 73p. |
| [25] | Cochran, W. G. (1963). Sampling Techniques, 2nd Ed., New York: John Wiley and Sons, Inc. |
| [26] | Francesch, A., Villalba, I. & Cartañà, M. 2011. Methodology for Morphological Characterization of Chicken and Its Application to Compare Penedesenca and Empordanesa Breeds. Animal Genetic Resources, 48: 79–84. |
| [27] | SAS. 2008. Statistical Analysis System. Version 9.2, SAS Institute Inc., Cary, NC., USA. |
| [28] | Semakula, J., Lusembo, P., Kugonza, D. R., Mutetikka, D., Ssennyonjo, J. and Mwesigwa, M. 2011. Estimation of live body weight using zoometrical measurements for improved marketing of indigenous chicken in the Lake Victoria basin of Uganda. Livestock Research for Rural Development. Volume 23. |
| [29] | Guni, F. S., Katule, A. M. and Mwakilembe, P. A. A. 2013. Characterization of Local Chickens in Selected Districts of the Southern Highlands of Tanzania: II. Production and Morphometric Traits. Livestock Research for Rural Development. 25(190). Retrieved March 14, 2019, from http://www.lrrd.org/lrrd25/11/guni25190.htm |
| [30] | Dahloum, L., Moula, N., Halbouche, M. and Mignon-Grasteau, S. 2016. Phenotypic characterization of the indigenous chickens (Gallus gallus) in the northwest of Algeria. Arch. Anim. Breed. 59: 79-90. |
| [31] | Olawunmi, O. O., salako, A. E. and Afuwape, A. A. 2008. Morphometric differentiation and assessment of function of the Fulani and Yoruba ecotype indigenous chickens of Nigeria. Int. J. Morphol., 26(4): 975-980. |
| [32] | Yakubu A., Kuje D. & Okpeku, M. 2009. Principal Components as Measures of Size and Shape in Nigerian Indigenous Chickens. Thai Journal of Agricultural Science, 42(3): 167-176. |
| [33] | Daikwo, I. S., Okpe, A. A. & Ocheja, J. O. 2011. Phenotypic Characterization of Local Chickens in Dekina. International Journal of Poultry Science, 10(6): 444-447. |
| [34] | Al-Qamashoui, B., Mahgoub, O., Kodim, I. & Schlecht, E. 2014. Towards Conservation of Omani Local Chicken: Phenotypic Characteristics, Management Practices and Performance Traits. Asian Australas. J. Anim. Sci., 27(6): 767-777. |
| [35] | Guni, F. S. & Katule, A. M. 2013. Characterization of Local Chickens in Selected Districts of the Southern Highlands of Tanzania: I. Qualitative Characters. Livestock Research for Rural Development, 25(9). |
| [36] | Addis, G., Kefyalew, A. & Zewdu, W. 2014. Phenotypic Characterization of Indigenous Chicken Ecotypes in North Gondar Zone, Ethiopia. Global Veterinaria, 12(3): 361-368. |
| [37] | Alemu, Y. & Tadelle, D. 1997. The Status of Poultry Research and Development in Ethiopia, Research Bulletin No. 4, Poultry Commodity Research Program Debrezeit Agricultural Research Center. Alemaya University of Agriculture, Ethiopia. pp. 62. |
| [38] | Brown, M. M., B. Alenyorege, G. A. Teye and R. Roessler. 2017. Phenotypic Diversity, Major Genes and Production Potential of local Chicken and Guinea Fowl in Tamale, Northern Ghana, Asian-Australas J. Anim Sci., 30(10): 1372-1381. |
| [39] | Ajayi, O. O., M. A. Adeleke, M. T. Sanni, A. Yakubu S. O. Peters, I. G. Imumorin, M. O. Ozoje, C. O. N. Ikeobi and O. A. Adebambo. 2012. Application of Principal Component and Discriminant Analyses to Morpho-Structural Indices of Indigenous and Exotic Chickens Raised under Intensive Management System. Trop Anim Health Prod., 44: 1247-1254. |
| [40] | Yakubu, A. and Ari, M.M. 2018. Principal component and discriminant analyses of body weight and conformation traits of Sasso, Kuroiler and indigenous Fulani chickens in Nigeria. JAPS; Journal of Animal and Plant Sciences, 28(1): 46-55. |
| [41] | Rotimi, E.A., Egahi, J.O. and Adeoye, A.A. 2016.Phenotypic characterization of Indigenous chicken population in Gwer-West, Benue State, Nigeria. World Scientific News, 3(53): 343-353. |
| [42] | Krittaphak, B., Charan, C., Chainarong, W. and Watchara, L. 2016. Phenotypic characterization of Thai native black –bone chickens indigenous to northern Thailand, Thai J. Vet. Med. 46(4): 547-554. |
APA Style
Markos, S., Belay, B., Dessie, T. (2024). On-Farm Phenotypic Characterization of Indigenous Chicken Ecotypes in the Western Tigray Region of Northern Ethiopia. Ecology and Evolutionary Biology, 9(2), 37-60. https://doi.org/10.11648/j.eeb.20240902.12
ACS Style
Markos, S.; Belay, B.; Dessie, T. On-Farm Phenotypic Characterization of Indigenous Chicken Ecotypes in the Western Tigray Region of Northern Ethiopia. Ecol. Evol. Biol. 2024, 9(2), 37-60. doi: 10.11648/j.eeb.20240902.12
AMA Style
Markos S, Belay B, Dessie T. On-Farm Phenotypic Characterization of Indigenous Chicken Ecotypes in the Western Tigray Region of Northern Ethiopia. Ecol Evol Biol. 2024;9(2):37-60. doi: 10.11648/j.eeb.20240902.12
@article{10.11648/j.eeb.20240902.12,
  author = {Shishay Markos and Berhanu Belay and Tadelle Dessie},
  title = {On-Farm Phenotypic Characterization of Indigenous Chicken Ecotypes in the Western Tigray Region of Northern Ethiopia
},
  journal = {Ecology and Evolutionary Biology},
  volume = {9},
  number = {2},
  pages = {37-60},
  doi = {10.11648/j.eeb.20240902.12},
  url = {https://doi.org/10.11648/j.eeb.20240902.12},
  eprint = {https://article.sciencepublishinggroup.com/pdf/10.11648.j.eeb.20240902.12},
  abstract = {The study was conducted to characterize morphometric traits of indigenous chickens and determine the relationships among the traits in three agro-climatic regions of western zone of Tigray regional state of Ethiopia. Twenty- one morphometric traits from 770 local chickens (412 hens, 358 cocks) were measured and analyzed using the PROC GLM of SAS 2008. Tukey mean comparison was used to analyze significantly different traits. Correlation analysis was used to determine the relationships among the traits. Significant variations were found in most traits among ecotypes, with males showing higher values in many traits. Kolla chickens generally exhibited higher values, except for neck length, skull length, and wattle, earlobe, comb, and beak indices. Interactions between sex and ecotypes significantly affected the morphometric traits. The strength and direction of significant correlations among the quantitative traits varied across the chicken ecotypes and sexes. The variation in morphometric measurements among the chicken ecotypes is an indicator of genetic diversity in the study area, calling for a community-centered holistic genetic enhancement program.
},
 year = {2024}
}
TY  - JOUR
T1  - On-Farm Phenotypic Characterization of Indigenous Chicken Ecotypes in the Western Tigray Region of Northern Ethiopia

AU  - Shishay Markos
AU  - Berhanu Belay
AU  - Tadelle Dessie
Y1  - 2024/07/23
PY  - 2024
N1  - https://doi.org/10.11648/j.eeb.20240902.12
DO  - 10.11648/j.eeb.20240902.12
T2  - Ecology and Evolutionary Biology
JF  - Ecology and Evolutionary Biology
JO  - Ecology and Evolutionary Biology
SP  - 37
EP  - 60
PB  - Science Publishing Group
SN  - 2575-3762
UR  - https://doi.org/10.11648/j.eeb.20240902.12
AB  - The study was conducted to characterize morphometric traits of indigenous chickens and determine the relationships among the traits in three agro-climatic regions of western zone of Tigray regional state of Ethiopia. Twenty- one morphometric traits from 770 local chickens (412 hens, 358 cocks) were measured and analyzed using the PROC GLM of SAS 2008. Tukey mean comparison was used to analyze significantly different traits. Correlation analysis was used to determine the relationships among the traits. Significant variations were found in most traits among ecotypes, with males showing higher values in many traits. Kolla chickens generally exhibited higher values, except for neck length, skull length, and wattle, earlobe, comb, and beak indices. Interactions between sex and ecotypes significantly affected the morphometric traits. The strength and direction of significant correlations among the quantitative traits varied across the chicken ecotypes and sexes. The variation in morphometric measurements among the chicken ecotypes is an indicator of genetic diversity in the study area, calling for a community-centered holistic genetic enhancement program.

VL  - 9
IS  - 2
ER  -
Humera Begait Research Center of Tigray Agricultural Research Institute, Mekelle, Ethiopia
College of Agriculture and Veterinary Medicine, Jimma University, Jimma, Ethiopia
International Livestock Research Institute (ILRI), Addis Ababa, Ethiopia
Information