Research Article | | Peer-Reviewed

Preparation and Evaluation of Ranitidine Hydrochloride Floating Microspheres

Received: 9 June 2024     Accepted: 25 June 2024     Published: 8 July 2024
Views:       Downloads:
Abstract

Introduction: Ranitidine hydrochloride, a member of the H2-receptor antagonist class, is widely employed in treating gastrointestinal conditions like ulcers, gastroesophageal reflux disease (GERD) and Zollinger-Ellison syndrome by reducing gastric acid production. Microspheres, designed for extended drug delivery and enhanced bioavailability, were formulated and evaluated in this study. Aim: To develop ranitidine hydrochloride microspheres capable of prolonging drug delivery and improving bioavailability. Methods: The inotropic gelation method was utilized to prepare alginate microspheres incorporating polymers such as ethyl cellulose, sodium carboxymethyl cellulose, HPMC, and carbopol®. The resulting drug-loaded microspheres exhibited spherical rigidity after cross-linking with a 10% w/v calcium chloride solution. Evaluation parameters including Fourier transform infra-red (FTIR) analysis, precompression characteristics, percentage yield, swelling index, and drug content were determined. Results: The FTIR results obtained, showed there was no incompatibility among the excipients and the active pharmaceutical ingredient. The Scanning electron microscopy (SEM) obtained, indicated the presence of spherical particles present in the formulation. The pre-compression evaluation showed that the angle of repose ranged from 4.85 ± 0.02 to 7.22 ± 0.06o for batched F4 and F1 respectively, while the Carr’s index ranged from 73.5 ± 2.47% to 87.00 ± 3.53% for batches F-7 and F-1 respectively. The percentage yield ranged from 73.5 ± 2.47% to 87.00 ± 3.53% for batches F-7 and F-1 respectively. In vitro drug release studies revealed sustained drug release over 4 hours, with a maximum release of 69.50 ± 1.77% observed for batch F-1. Conclusion: Overall, the formulated ranitidine hydrochloride microspheres demonstrated prolonged and controlled release characteristics, indicating their potential for use in controlled drug delivery applications.

Published in American Journal of Polymer Science and Technology (Volume 10, Issue 2)
DOI 10.11648/j.ajpst.20241002.12
Page(s) 36-46
Creative Commons

This is an Open Access article, distributed under the terms of the Creative Commons Attribution 4.0 International License (http://creativecommons.org/licenses/by/4.0/), which permits unrestricted use, distribution and reproduction in any medium or format, provided the original work is properly cited.

Copyright

Copyright © The Author(s), 2024. Published by Science Publishing Group

Keywords

Ranitidine Hydrochloride, Drug Delivery, Microspheres, Formulation, Ulcer

1. Introduction
The process of gastric emptying for certain dosage forms can vary significantly, particularly those with prolonged stomach residence compared to conventional ones . When designing controlled-release dosage forms, multiple factors need consideration to ensure optimal absorption and bioavailability. For instance, challenges arise in targeting specific areas within the gastrointestinal tract (GIT) effectively. The absorption of a drug is directly linked to its contact time with the small intestine mucosa . Controlled-release formulations aim to release drugs at a predetermined rate, maintaining desired drug concentrations over specific time intervals while minimizing side effects . Gastric retentive systems are tailored to prolong retention within the GIT, thereby extending drug exposure in the gastric region and enhancing absorption potential . Various methods, such as floating drug delivery systems (FDDS), are utilized to prolong gastric retention .
Floating microspheres offer several advantages that render them appealing for drug delivery purposes . Firstly, they facilitate sustained drug release, thereby enhancing therapeutic outcomes. Secondly, their versatility allows for easy formulation with various drugs to cater to specific requirements. Thirdly, they enable straightforward administration without necessitating high dosages. Lastly, they boast stability and prolonged storage capabilities .
Functionally, floating microspheres operate by encapsulating the drug within a polymer matrix, shielded by a membrane . This matrix facilitates controlled drug release over time, while the membrane prevents rapid release. Designed to be buoyant, these microspheres float in gastric fluid, prolonging their residence time in the stomach. This prolonged contact enhances drug absorption and bioavailability by extending interaction with the stomach lining. Additionally, floating microspheres can shield the drug from stomach degradation .
The development and assessment of floating microspheres containing ranitidine hydrochloride are essential for pharmaceutical research . Gastro retentive systems, particularly floating microspheres, offer a viable approach to prolong drug residence time in the stomach, thereby enhancing drug absorption and therapeutic effectiveness. Despite the proven success of floating microspheres with other drugs, their application to ranitidine hydrochloride remains largely unexplored, highlighting a gap in current pharmaceutical research .
2. Materials and Methods
Ranitidine (RAN/4/2010/00680F), was purchased from Emzor Pharmaceuticals Ltd, Lagos. Sodium alginate, ethyl cellulose, sodium carboxyl methyl cellulose (Na-CMC), were purchased from (Sigma Aldrich, Kosher, USA). Methanol was obtained from (Astron Chemicals, Ahmedabad), Glycerin and sodium hydroxide were provided from (Mingtai Chemical Taiwan), Calcium chloride was obtained from (Evonik, Germany), Hydroxy propyl methyl cellulose (HPMC) were obtained from (DFE Pharma, UK), Sorbitol was obtained from (TCI, USA). Distilled water was obtained from (UNN Water Resources Management Laboratories Ltd; UNN, Enugu State, Nigeria).
2.1. Preformulation Studies
Some of the pre-formulation studies carried out in this research include: drug identification, compatibility of the drugs/excipients and formular development. Drug-excipient compatibility study (FTIR spectroscopy) Infra-red spectra of pure drug, and other excipients were obtained by (Shimadzu 8400S Japan) FTIR spectrometer. The samples were previously ground and mixed thoroughly with potassium bromide, an infra-red transparent matrix at 1:5 (sample: KRr) ratio respectively. The KBr discs were prepared by compressing the powders at a pressure of 5 tons for 5 minutes in a hydraulic press. The scans were obtained at a resolution of 4 cm-1 from 4000 to 400 cm-1.
2.2. Method of Preparation
Orifice inotropic gelation method was used for the preparation of ranitidine microspheres using polymers such as ethyl cellulose (EC), Na-CMC, hydroxypropyl methyl cellulose (HPMC) and sodium alginate. A homogenous polymser solution was prepared by dissolving Sodium alginate (1g) and the polymers (1g) in purified water (32 ml). Then ranitidine (1g), the active substance was added to the polymer solution and stirred thoroughly to form a viscous dispersion. A 10% w/v calcium chloride solution was prepared which has been used as a cross linking agent. The prepared dispersion was then manually added drop wise into calcium chloride (10% w/v) solution (40 ml) with the help of a syringe having a needle of size no.18. The calcium chloride solution having the droplets was then allowed to stay for 15 minutes for the curing reaction to take place and produce spherical rigid drug loaded spheres. The spheres obtained after the reaction were then collected and washed repeatedly with acetone. After washing, it is required to dry the spheres properly at 45°C for 6 hours.
Table 1. Composition of formulations.

Ingredients (g)/Batches

F-1

F-2

F-3

F-4

F-5

F-6

F-7

F-8

F-9

Ranitidine

1

1

1

1

1

1

1

1

1

Sodium alginate

1

1

0.8

1

0.8

1

0.8

1

0.8

Ethyl cellulose

1

0.2

1

-

-

-

-

-

-

Na-CMC

-

-

-

1

0.2

1

-

-

-

HPMC

-

-

-

-

-

-

1

0.2

1

Acetone (ml)

30

30

30

30

30

30

30

30

30

Cacl2

10

10

10

10

10

10

10

10

10

2.3. Yield Analysis of the Recovered Microspheres
The relative yield was calculated based on the amount of microspheres of each formulation obtained relative to the amount of solid materials used in the dispersed phase. The percentage yield was calculated according to the following equation :
Yield %= actual weight of microspherestotal weight of drug and polymer ×100(1)
2.4. Pre-compression Evaluation of Powder Blend
2.4.1. Angle of Repose
Angle of repose is defined as the maximum angle possible between the surface of a pile of the powder and the horizontal plane. A plastic funnel in ring-supported by a retort stand. A sheet of paper was placed below the funnel assembly. A sheet of fibre board was placed below the funnel orifice making sure it fits tightly. A given quantity of the microsphere (30 g) was transferred into the funnel. The fibre sheet was drawn away and the timer simultaneously started. The timer was stopped when all of the powder had passed through the funnel. The height of the heap was measured using a graduated ruler. A pencil was used to outline the base of the contour. The angle of the conical heap so formed was determined from equation 2. The powder was returned to the funnel and the experiment was repeated thrice.
tanθ=height of powderheap, (h)radius of powder heap, (r)(2)
2.4.2. Bulk Density
This is the ratio between given mass of powder and its bulk volume. A weighed quantity of the microsphere (30.0 g) was placed in a 100-ml graduated cylinder. The cylinder was gently dropped onto a wooden surface three times from a height of one inch at 2 sec interval. The volume assumed after the treatment was taken as the bulk volume. The experiment was repeated thrice.
Bulk density g/ml= mass bulk volume(3)
2.4.3. Tapped Density
This is the ratio between given mass of powder and its bulk volume. A weighed quantity (30.0 g) of the powder was placed in a 100-ml graduated cylinder. The cylinder was tapped up to 500 times on the wooden surface or to a constant volume. The final volume attained represents the tapped volume. The experiment was repeated thrice.
Tapped density gml=masstapped volume(4)
2.4.4. Carr’s Index
This is used to access the flowability of a powder. The Carr’s compressibility index (CI %) was calculated from the poured (bulk density) and tapped densities. CI was calculated using the following equation.
Carr's index= Tapped density -bulk densityTapped density ×100(5)
2.4.5. Hausner’s Ratio
The Hausner’s ratio (HR), defined as the ratio of tapped to bulk densities. It is a common technique widely used to describe the packing behavior of powders when they are subjected to tapping.
Hausner ratio= tapped densitybulk density(6)
2.4.6. Swelling Index
The weight of the microspheres was taken and then dispersed in phosphate buffer (pH 7.2) for 12 hours. The excess liquid was removed using blotting paper and the weight of the swollen microspheres taken. The swelling index was calculated thus:
Swelling index= Weight of swollen microsphers-weight of dried microsphersweight of swollen microspheres(7)
2.4.7. Drug Content
A 1 gm quantity of sample was taken and dissolved in 100 ml distilled water in a beaker. After 6 hours, the sample was filtered and suitable dilution was done. Then the absorbance of the solution is measured at 313 nm and drug content was calculated.
2.4.8. Dissolution Study
The 500 ml of distilled water was placed in the dissolution apparatus (USP apparatus type-II paddle method) was assembled. The sample was then placed in the vessel and the apparatus was operated for 4 hrs at 50 rpm. The definite time interval, 5 ml was withdrawn from the vessel and another 5 ml of the blank was added to the vessel. The withdrawn fluid is then filtered and suitable dilution was done. Samples are then analyzed under UV Spectrophotometer at 313 nm.
2.4.9. Morphology of the Ranitidine Microspheres
The morphology of the obtained microspheres was examined by a light microscope (Zeiss, Me 63 C, West Germany) with varied magnification powers. One drop of the freshly prepared microsphere suspension was poured onto a slide and sealed with a cover glass. Photomicrographs were captured using Samsung digital camera . The morphology, size uniformity and aggregation or coalescence of the microspheres were studied.
2.4.10. Data Analysis
All the measurements were repeated at least thrice and the data obtained analyzed by Student t-test and One-Way Analysis of Variance (ANOVA). Statistical analysis was performed using Statistical Product and Services Solution software (SPSS, version 22.0 Inc., Chicago IL, USA) and Excel Microsoft Office version 2012. The results were presented as mean ± SD, and statistical differences between means considered significant at (p < 0.05).
3. Results and Discussion
3.1. Organoleptic Properties of the Drug (Drug Identification)
Table 2 showed the organoleptic properties of ranitidine. The drug had a choking smell. The colour of the drug was white, had a bitter taste and the texture was fine powder.
Table 2. Organoleptic properties of the drug Property.

Ranitidine

Odour

Choking

Colour

White

Taste

Bitter

Texture

Fine powder

3.2. FTIR Compatibility Studies
FTIR Spectroscopy (drug- excipient compatibility studies)
Figure 1: shows the characteristic peaks of ranitidine at 3819.7, 3211.5, 2590.9, 1880.6 and 1347.4 cm-1 corresponding to -OH, -NH single bond stretch, C-H single bong stretch, nitriles, C=O, C=C and C=N and C-O, C-N, C-C single bond stretch respectively.
Figure 2: shows the characteristics peaks of ethyl cellulose at 3925.2, 3245.2, 2582.1, 1997.8 and 1468.4 cm-1 corresponding to O-H, N-H single bond stretch, C-H single bond stretch, carbenes triple bond, C=O, C=C double bond and C-C, C-O single bond respectively. According to Mayavansh et al, the spectrum of EC showed characteristic peaks at 3390 and a band at 1636 cm-1 corresponding to the stretching and bending modes of the surface hydroxyls. The peak at 2905 cm-1 belongs to the asymmetrically stretching vibration of C-H in a pyramid ring and the broad absorption peak at 1059 cm-1 is attributed to the C-O of cellulose .
Figure 3: shows the characteristic peaks of sodium carboxymethyl cellulose at 3852.3, 3169.1, 2554.2, 1993.8 and 1495.6 cm-1 corresponding to O-H, N-H single bond stretch, C-H single bond stretch, nitriles and carbenes triple bond, C=O, C=C double bond and C-O, C-C single bond respectively. According to Oth et al (2020), the spectrum of Na-CMC showed characteristic peaks at 3700 cm-1 indicating the presence of –OH stretching bond. The strong bonds at 1093, 459 and 798 cm-1 were associated to the asymmetric and symmetric Si-O—Si stretching vibration bonding .
Figure 4: shows the characteristic peaks of HPMC at 3675.0, 3269.4, 2434.3, 1900.5 and 1428.8 corresponding to –O-H, single bond stretch, C-H single bond stretch, nitriles and carbenes triple bond, C=O C=C double bond, C-O, C-C single bond respectively. According to Chaudheri et al; the spectrum of starch showed characteristics peaks at 3448 for –OH stretching, 2930 for –CH stretching, 1646 for C-O bending associated with OH group, and 1381 cm-1 associated with –CH symmetric bending .
Figure 5: shows the characteristic peaks of calcium chloride at 3900.1, 3143.6, 2427.5, 1873.9 and 1454.0 corresponding to –OH, -NH single bond stretch, -CH single bond stretch, C=O, C=C and C -O, C-C single bond respectively. According to Alagusundaram et al, the twin peaks at 1577 and 1466 cm-1 were attributed to asymmetric carbohydrate (-COO) stretching vibration and symmetric carbohydrate vibration respectively, while peaks at 2917 and 2850 cm-1 were attributed to the –CH stretching vibration .
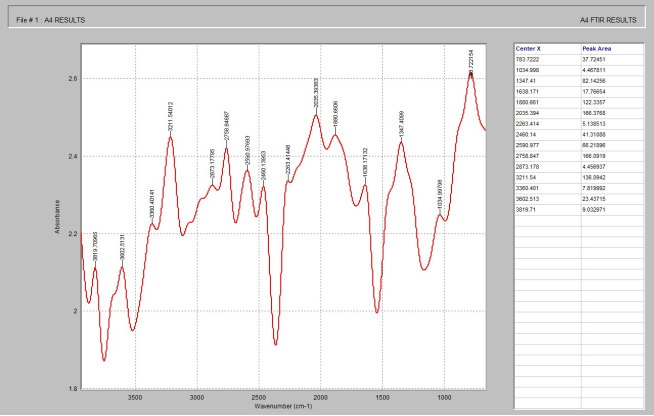
Figure 1. FTIR spectrum of Ranitidine.
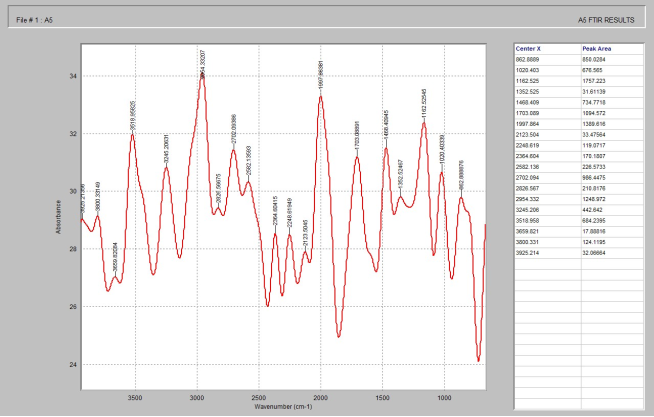
Figure 2. FTIR spectrum of ethyl cellulose.
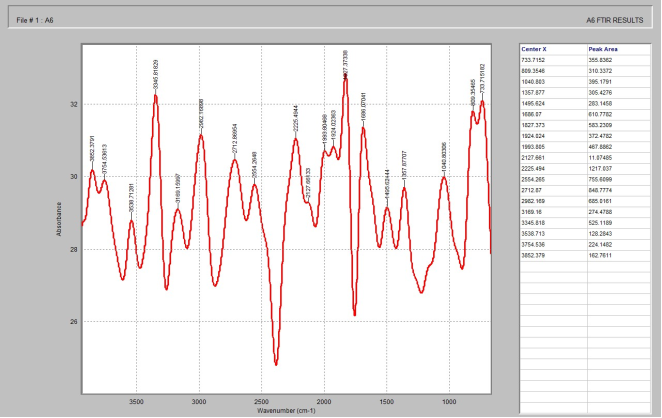
Figure 3. FTIR spectrum of carboxymethyl cellulose.
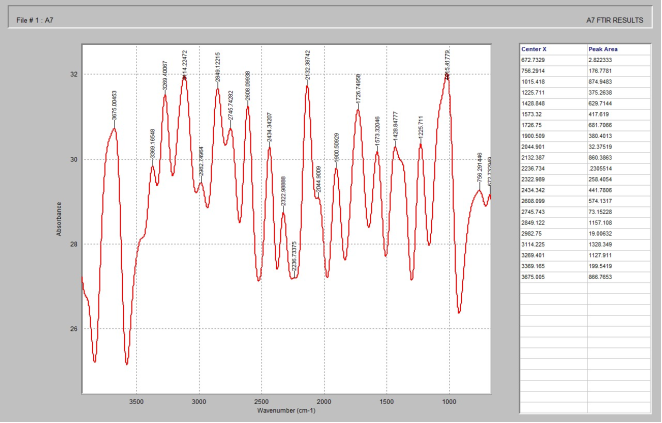
Figure 4. FTIR spectrum of HPMC.
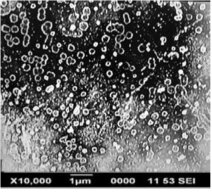
Figure 5. SEM for Batch F3.
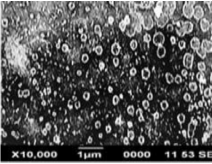
Figure 6. SEM for batch F5.
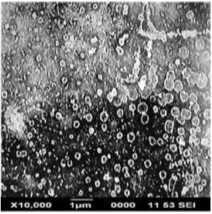
Figure 7. SEM for batch F9.
3.3. Post Compression Evaluation
3.3.1. Angle of Repose
The angle of repose is a characteristic of the internal function or cohesion of the particles. If a powder is non-cohesive, the angle of repose will be high, but if a powder is cohesive, the angle of repose will be low. The angle of repose of the formulations ranged from 3.525 ± 0.02 for batch F-5 to 9.415 ± 0.36 for batch F-3.
3.3.2. Bulk Density
Bulk density was used to measure the flow properties of the powder. It is a function of the particle size and particle size distribution. It has a direct relationship with the flow characteristics of a powder. The bulk density of the formulations ranged from 0.507 ± 0.00 to 0.625 ± 0.01 for batches F-5 and F-7 respectively.
3.3.3. Tapped Density
Tapped density is a function of particle size and size distribution. It ranged from 0.502 ± 0.00 to 0.627 ± 0.02 for batches F4 and F6 respectively.
3.3.4. Carrs Index
This is affected by particle size and particle size distribution. According to BP specifications, excellent free flowing granules range from 5-15%, while good free flowing granules range from 12-16%. Very poor fluid cohesive powders have C.I of > 38%, while powders with C.I. > 40% indicates very poor flow. From the results obtained, it ranged from 13.04 ± 0.01 to 13.90 ± 0.03 for batches F-7 and F-1 respectively.
3.3.5. Hausners Ratio
It has a direct relationship between he tapped and bulk density. According to specifications, excellent free flowing granules range from 1.00 ± 1.11, while good free flowing granules range from 1.12 to 1.18. Very poor fluid cohesive powders have H.R. of 1.6 to 1.59. It ranged from 1.095 ± 0.05 to 1.138 ± 0.01 for batches F-3 and F-7 respectively.
Table 3. Flow properties of microspheres (mean ± SD).

Formulation code

Angle of repose (o)

Bulk density (g/ml)

Tapped density (g/ml)

Carr’s Index (%)

Hausners ratio

F-1

7.220 ± 0.06

0.530 ± 0.01

0.545 ± 0.00

13.90 ± 0.03

1.291 ± 0.18

F-2

3.657 ± 0.11

0.537 ± 0.02

0.602 ± 0.00

13.75 ± 0.02

1.056 ± 0.01

F-3

9.415 ± 0.36

0.511 ± 0.01

0.616 ± 0.01

14.55 ± 0.02

1.095 ± 0.05

F-4

4.855 ± 0.02

0.444 ± 0.02

0.502± 0.00

14.90 ± 0.02

1.035 ± 0.01

F-5

3.525 ± 0.02

0.507 ± 0.00

0.594 ± 0.01

15.05 ± 0.01

1.173 ± 0.05

F-6

4.491 ± 0.01

0.592 ± 0.01

0.627 ± 0.02

12.75 ± 0.01

1.154 ± 0.00

F-7

5.045 ± 0.02

0.625 ± 0.01

0.618 ± 0.00

13.04 ± 0.01

1.139 ± 0.01

F-8

6.627 ± 0.16

0.507 ± 0.00

0.628 ± 0.02

13.00 ± 0.01

1.265 ± 0.07

F-9

6.845 ± 0.03

0.623 ± 0.01

0.633 ± 0.01

13.89 ± 0.01

1.360 ± 0.03

3.3.6. Percentage Yield of the Ranitidine Hydrochloride Microspheres
The yield of different microspheres varied from 83.00 ± 3.53 to 73.50 ± 2.47 for batches F-9 and F-7 respectively, when the drug polymer ratio was changed from 1:1 to 0.8. According Jemini et al, the reduction in the percentage yield with increasing drug/polymer ratio may be due to the loss of smallest and lightest particles during filtration and washing processes .
Table 4. The percentage yield of ranitidine hydrochloride microspheres (mean ± SD).

Formulation code

Yield (%) ± SD

F-1

87.00 ± 3.53

F-2

82.5 ± 1.76

F-3

77.00 ± 0.70

F-4

81.00 ± 4.24

F-5

77.00 ± 1.41

F-6

83.00 ± 2.12

F-7

73.5 ± 2.47

F-8

84.00 ± 0.70

F-9

83.00 ± 2.21

3.3.7. Swelling Index and Drug Content of Ranitidine Hydrochloride Microspheres
The swelling index is used to determine the amount of phosphate buffer absorbed by the microspheres after dissolving them in the buffer. From the result obtained, it ranged from 62.50 ± 0.35 to 82.50 ± 1.06 for batches F-1 and F-9 respectively.
The drug content was determined for the 9 formulations. It was found to be between 24.50 ± 2.47% to 41.00 ± 4.24% for F-1 and F-9 respectively. This depicts that the formulation F9 containing polymer Carbopol gave the highest drug content, while formulation 1 that didn’t contain any polymer gave the least drug content.
Table 5. Swelling index and Drug content of ranitidine hydrochloride microspheres (mean ± SD).

Formulation code

Swelling index (%)

Drug content (%)

F-1

62.50 ± 0.35

24.50 ± 2.47

F-2

67.50 ± 1.77

30.50 ± 3.18

F-3

71.00 ± 0.71

28.00 ± 0.00

F-4

76.00 ± 1.41

31.00 ± 2.83

F-5

77.50 ± 3.89

28.50 ± 1.77

F-6

78.50 ± 3.18

29.00 ± 0.71

F-7

76.50 ± 4.60

34.00 ± 1.71

F-8

80.50 ± 0.35

30.50 ± 0.35

F-9

82.50 ± 1.06

41.50 ± 4.24

3.3.8. In Vitro Release Study
The release study of ranitidine hydrochloride microspheres were done for 4 hours in phosphate buffer (pH 7.4). The microspheres formed demonstrated controlled release of the drug. From the results obtained, formulation 1 gave the highest drug release of 69.50%, while formulation 9 having HPMC gave the lowest release of 39.75%. The microspheres could be said to provide a better carrier system for controlled drug delivery.
Table 6. Drug release profile of ranitidine hydrochloride microspheres (mean ± SD).

Time (mins)/ Batch

F-1

F-2

F-3

F-4

F-5

F-6

F-7

F-8

F-9

0

0.00

0.00

0.00

0.00

0.00

0.00

0.00

0.00

0.00

15

2.35 ± 0.25

2.10 ± 0.35

2.55 ± 0.35

2.55 ± 0.18

2.55 ± 0.18

2.35 ± 0.25

2.40 ± 0.07

2.65 ± 0.46

2.15 ± 0.25

30

7.60 ± 0.57

8.10 ± 0.07

7.80 ± 0.42

7.7 ± 0.14

7.65 ± 0.18

8.00 ± 0.35

7.95 ± 0.04

7.90 ± 0.35

8.20 ± 0.14

60

17.25 ± 1.59

7.80 ± 2.97

17.85 ± 2.02

15.10 ± 0.70

9.00 ± 4.24

7.77 ± 2.89

16.45 ± 1.03

17.55 ± 1.80

11.65 ± 0.11

90

35.20 ± 0.57

14.90 ± 0.07

35.00 ± 0.71

27.05± 2.16

19.85 ± 2.93

15.85 ± 0.81

36.50 ± 1.06

26.25± 1.59

15.40 ± 0.49

120

47.80 ± 0.57

13.65 ± 3.08

43.00 ± 1.41

35.65 ± 0.25

27.00 ± 6.36

18.20 ± 0.14

36.50 ± 2.12

33.75 ± 1.59

17.60 ± 0.28

150

51.00 ± 2.83

20.85± 0.60

50.00 ± 2.12

39.75 ± 0.18

29.75 ± 7.25

19.75 ± 0.04

51.25 ± 0.88

42.30 ± 2.62

19.70 ± 0.07

180

57.00 ± 4.95

23.45 ± 0.32

55.00 ± 2.47

48.70 ± 1.20

37.85 ± 6.47

24.00 ± 0.28

57.40 ± 0.42

51.20 ± 0.85

25.73 ± 0.88

210

64.00 ± 2.83

25.35 ± 0.46

65.00 ± 3.53

54.60 ± 0.99

41.35 ± 9.90

25.90 ± 0.42

62.20 ± 0.14

58.35 ± 0.25

33.05 ± 1.73

240

69.50 ± 1.77

29.95 ± 0.17

62.50 ± 1.06

62.40 ± 1.70

45.00 ± 9.98

29.40 ± 3.04

64.75 ± 1.94

64.75 ± 3.36

39.75 ± 0.53

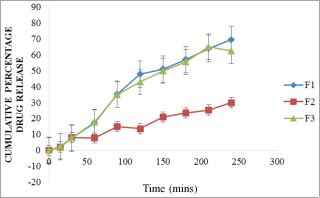
Figure 8. Cumulative percentage drug release of batches F-1 to F-3.
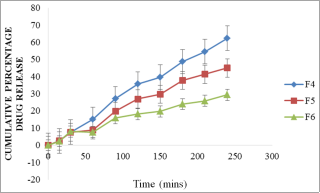
Figure 9. Cumulative percentage drug release of batches F-4 to F-6.
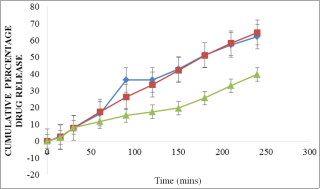
Figure 10. Cumulative percentage drug release of batches F-7 to F-9.
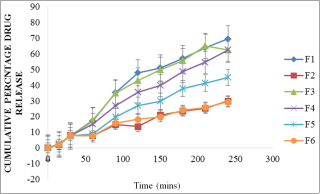
Figure 11. Cumulative percentage drug release of batches F-1 to F-6.
3.3.9. Morphology of the Ranitidine Hydrochloride Microspheres
The morphology of the obtained microspheres was examined by a light microscope (Zeiss, Me 63 C, West Germany) with varied magnification powers (Figures 5-7).
Results obtained showed the presence of spherical shapes of different shapes and sizes. The smoothness of the ranitidine hydrochloride floating microspheres was increased by increasing the polymer concentration. The ranitidine hydrochloride microspheres with HPMC contained smooth surface and smaller in size compared to the microspheres with ethyl cellulose.
Table 7. Determination of maximum wavelength of ranitidine.

Concentration (µg/ml)

Absorbance

0.0

0.0

1.0

0.107

2.0

0.200

3.0

0.283

4.0

0.371

5.0

0.456

6.0

0.539

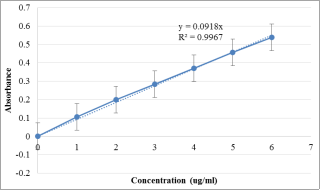
Figure 12. Standard beer’s plot of ranitidine at 315 nm.
Table 8. Determination of calibration curve of ranitidine in pH 6.8 at 315 nm.

Concentration (µg/ml)

Absorbance

0.0

0.0

6

0.160

10

0.289

15

0.450

20

0.590

25

0.720

30

0.870

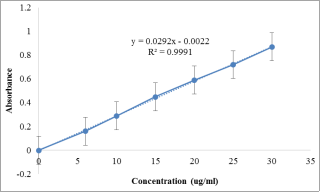
Figure 13. Calibration curve of ranitidine at 315 nm.
4. Conclusion
The overall idea of formulating floating microspheres containing ranitidine hydrochloride gave a suitable practical approach to achieve a prolonged therapeutic effect by releasing the active drug over an extended period of time.
Abbreviations

GIT

Gastrointestinal Tract

FDDS

Floating Drug Delivery Systems

RAN

Ranitidine

Na-CMC

Sodium Carboxylmethyl Cellulose

FTIR

Fourier Transform Infrared

EC

Ethyl Cellulose

HPMC

Hydroxypropyl Methyl Cellulose

C.I

Carr’s Index

H.R

Hausner’s Ration

Author Contributions
Ezegbe Chekwube Andrew: Conceptualization, Supervision
Nwankwo Emmanuel Chinedu: Methodology, Writing – original draft
Onunkwo Chukwunwike Godswill: Funding acquisition, Project administration
Okafor Nnedimma Pauline: Investigation, Writing – review & editing
Okorie James Ekemezie: Methodology, writing
Anikwe Celestine Chidera: Methodology, writing
Conflicts of Interest
The authors declare no conflicts of interest.
References
[1] Agrawal, A. M., Neau, S. H. and Bonate, P. L. (2003). Wet granulation fine particle ethylcellulose tablets: effect of production variables and mathematical modeling of drug release. AAPS Journal, 5, 48-60.
[2] Chen YC, Ho HO, Liu DZ, Siow WS, Sheu MT. (2015). Swelling/floating capability and drug release characterizations of gastro-retentive drug delivery system based on a combination of hydroxyethyl cellulose and sodium carboxymethyl cellulose. PLoS One 10 (1): e0116914.
[3] Badve, S. S., Sher, P., Korde, A., Pawar, A. P. (2007). Development of hollow/porous calcium pectinate beads for floating-pulsatile drug delivery. European Journal Pharmaceutical Biopharmacy, 65: 85–93.
[4] Bardronnet, P., Faivre, V., Pugh, W. J., Piffaretti, J. C., Falson, F. (2006). Gastroretentive dosage forms: overview and special case of Helicobacter pylori. Journal Control Release. 111: 1–18.
[5] Batra, D., Kakar, S., Singh, R., Nautiyal, U., (2012). Magnetic microspheres as a targeted drug delivery system: An overview, Jddr. 1(3): 1-1.
[6] Bakowsky H, Richter T, Kneuer C, Hoekstra D, Rothe U, Bendas G. (2008). Adhesion characteristics and stability assessment of lectin-modified liposomes for site-specific drug delivery. Biochim Biophys Acta (1): 242-9.
[7] Shoufeng Li, Yie W. Chien, Bruce P. Daggy and Haresh L. (2001). Statistical optimization of gastric floating system for oral controlled delivery AAPS Pharm Sci Tech. 2(1): 123-130.
[8] Chauhan, B., Shimpi, S., Mahadik, K. R., Paradkar, A. (2004). Preparation and evaluation of floating risedronate sodium Gelucire 39/01 matrices. Acta Pharm. 54: 205–14.
[9] Jaimini, M., Rana, A. C., Tanwar, Y. S. (2007). Formulation and evaluation of famotidine floating tablets. Curr Drug Deliv. 4: 51–5.
[10] Jain, S. K., Agrawal, G. P., Jain, N. K. (2006a). A novel calcium silicate-based microspheres of repaglinide: in vivo investigations. Journal Control Release, 113: 111–6.
[11] Gayathridevi M, J. Adlin Jino Nesalin and T. Tamizh Man. (2016). A review of Floating Microspheres. International journal of research in pharmacy and chemistry. 6(3), 501-510.
[12] Julan, M., Desai, U., Parikh, J. R., Parikh, R. H. (2005). Floating drug delivery systems: an approach to gastroretention. 2005. Available online at:
[13] Hirtz, J. (1985). The gastrointestinal absorption of drugs in man: a review of current concepts and methods of investigation. British Journal of Clinical Pharmacology, (19), 775-83S.
[14] Patel, V., Patel, N., and Yeole, P. (2005). Studies on formulation and evaluation of ranitidine floating tablets. Indian Journal of Pharmaceutical Sciences, (67), 703.
[15] Mayavanish, A. and Gajjar, S. (2008). Floating drug delivery sysytems to increase gastric retention of drugs: A Review. Research Journal of Pharmacy and Technology, (1), 345-348.
[16] Oth M., Frranz, M., Timmermans, J. and Moes, A. (1992). The bilayer floating capsule: a stomach-directed drug delivery system for misoprostol. Pharmaceutical Research, (9), 298-302.
[17] Chaudhari, A., Jadhav, K. R., Dr. Kadam, V. J., (2010). An over view: Microspheres as a nasal drug delivery system, International Journal Pharmaceutical Science Review Research, 5(1): 8-17.
[18] Alagusundaram, M., Chetty, C. M. S., Umashankari, K., Badarinath, A. V., Lavanya, C., Ramkanth, S. (2009). Microspheres as a novel drug delivery sytem- A review, International Journal Chemistry Technology Research, 1(3): 526-34.
[19] Jamini, M. and Rawat, S. (2013). A review on microsphere, Res. J. Pharm. boil. Chem. Sci., 4(1): 1223-33.
Cite This Article
  • APA Style

    Andrew, E. C., Chidera, A. C., Ekemezie, O. J., Pauline, O. N., Chinedu, N. E., et al. (2024). Preparation and Evaluation of Ranitidine Hydrochloride Floating Microspheres. American Journal of Polymer Science and Technology, 10(2), 36-46. https://doi.org/10.11648/j.ajpst.20241002.12

    Copy | Download

    ACS Style

    Andrew, E. C.; Chidera, A. C.; Ekemezie, O. J.; Pauline, O. N.; Chinedu, N. E., et al. Preparation and Evaluation of Ranitidine Hydrochloride Floating Microspheres. Am. J. Polym. Sci. Technol. 2024, 10(2), 36-46. doi: 10.11648/j.ajpst.20241002.12

    Copy | Download

    AMA Style

    Andrew EC, Chidera AC, Ekemezie OJ, Pauline ON, Chinedu NE, et al. Preparation and Evaluation of Ranitidine Hydrochloride Floating Microspheres. Am J Polym Sci Technol. 2024;10(2):36-46. doi: 10.11648/j.ajpst.20241002.12

    Copy | Download

  • @article{10.11648/j.ajpst.20241002.12,
      author = {Ezegbe Chekwube Andrew and Anikwe Celestine Chidera and Okorie James Ekemezie and Okafor Nnedimma Pauline and Nwankwo Emmanuel Chinedu and Onunkwo Chukwunwike Godswill},
      title = {Preparation and Evaluation of Ranitidine Hydrochloride Floating Microspheres
    },
      journal = {American Journal of Polymer Science and Technology},
      volume = {10},
      number = {2},
      pages = {36-46},
      doi = {10.11648/j.ajpst.20241002.12},
      url = {https://doi.org/10.11648/j.ajpst.20241002.12},
      eprint = {https://article.sciencepublishinggroup.com/pdf/10.11648.j.ajpst.20241002.12},
      abstract = {Introduction: Ranitidine hydrochloride, a member of the H2-receptor antagonist class, is widely employed in treating gastrointestinal conditions like ulcers, gastroesophageal reflux disease (GERD) and Zollinger-Ellison syndrome by reducing gastric acid production. Microspheres, designed for extended drug delivery and enhanced bioavailability, were formulated and evaluated in this study. Aim: To develop ranitidine hydrochloride microspheres capable of prolonging drug delivery and improving bioavailability. Methods: The inotropic gelation method was utilized to prepare alginate microspheres incorporating polymers such as ethyl cellulose, sodium carboxymethyl cellulose, HPMC, and carbopol®. The resulting drug-loaded microspheres exhibited spherical rigidity after cross-linking with a 10% w/v calcium chloride solution. Evaluation parameters including Fourier transform infra-red (FTIR) analysis, precompression characteristics, percentage yield, swelling index, and drug content were determined. Results: The FTIR results obtained, showed there was no incompatibility among the excipients and the active pharmaceutical ingredient. The Scanning electron microscopy (SEM) obtained, indicated the presence of spherical particles present in the formulation. The pre-compression evaluation showed that the angle of repose ranged from 4.85 ± 0.02 to 7.22 ± 0.06o for batched F4 and F1 respectively, while the Carr’s index ranged from 73.5 ± 2.47% to 87.00 ± 3.53% for batches F-7 and F-1 respectively. The percentage yield ranged from 73.5 ± 2.47% to 87.00 ± 3.53% for batches F-7 and F-1 respectively. In vitro drug release studies revealed sustained drug release over 4 hours, with a maximum release of 69.50 ± 1.77% observed for batch F-1. Conclusion: Overall, the formulated ranitidine hydrochloride microspheres demonstrated prolonged and controlled release characteristics, indicating their potential for use in controlled drug delivery applications.
    },
     year = {2024}
    }
    

    Copy | Download

  • TY  - JOUR
    T1  - Preparation and Evaluation of Ranitidine Hydrochloride Floating Microspheres
    
    AU  - Ezegbe Chekwube Andrew
    AU  - Anikwe Celestine Chidera
    AU  - Okorie James Ekemezie
    AU  - Okafor Nnedimma Pauline
    AU  - Nwankwo Emmanuel Chinedu
    AU  - Onunkwo Chukwunwike Godswill
    Y1  - 2024/07/08
    PY  - 2024
    N1  - https://doi.org/10.11648/j.ajpst.20241002.12
    DO  - 10.11648/j.ajpst.20241002.12
    T2  - American Journal of Polymer Science and Technology
    JF  - American Journal of Polymer Science and Technology
    JO  - American Journal of Polymer Science and Technology
    SP  - 36
    EP  - 46
    PB  - Science Publishing Group
    SN  - 2575-5986
    UR  - https://doi.org/10.11648/j.ajpst.20241002.12
    AB  - Introduction: Ranitidine hydrochloride, a member of the H2-receptor antagonist class, is widely employed in treating gastrointestinal conditions like ulcers, gastroesophageal reflux disease (GERD) and Zollinger-Ellison syndrome by reducing gastric acid production. Microspheres, designed for extended drug delivery and enhanced bioavailability, were formulated and evaluated in this study. Aim: To develop ranitidine hydrochloride microspheres capable of prolonging drug delivery and improving bioavailability. Methods: The inotropic gelation method was utilized to prepare alginate microspheres incorporating polymers such as ethyl cellulose, sodium carboxymethyl cellulose, HPMC, and carbopol®. The resulting drug-loaded microspheres exhibited spherical rigidity after cross-linking with a 10% w/v calcium chloride solution. Evaluation parameters including Fourier transform infra-red (FTIR) analysis, precompression characteristics, percentage yield, swelling index, and drug content were determined. Results: The FTIR results obtained, showed there was no incompatibility among the excipients and the active pharmaceutical ingredient. The Scanning electron microscopy (SEM) obtained, indicated the presence of spherical particles present in the formulation. The pre-compression evaluation showed that the angle of repose ranged from 4.85 ± 0.02 to 7.22 ± 0.06o for batched F4 and F1 respectively, while the Carr’s index ranged from 73.5 ± 2.47% to 87.00 ± 3.53% for batches F-7 and F-1 respectively. The percentage yield ranged from 73.5 ± 2.47% to 87.00 ± 3.53% for batches F-7 and F-1 respectively. In vitro drug release studies revealed sustained drug release over 4 hours, with a maximum release of 69.50 ± 1.77% observed for batch F-1. Conclusion: Overall, the formulated ranitidine hydrochloride microspheres demonstrated prolonged and controlled release characteristics, indicating their potential for use in controlled drug delivery applications.
    
    VL  - 10
    IS  - 2
    ER  - 

    Copy | Download

Author Information
  • Department of Pharmaceutical Technology and Industrial Pharmacy, University of Nigeria, Nsukka, Nigeria

  • Department of Pharmaceutics, University of Hertfordshire, Hatfield, United Kingdom

  • Department of Pharmaceutical Technology and Industrial Pharmacy, University of Nigeria, Nsukka, Nigeria

  • Department of Pharmaceutical Technology and Industrial Pharmacy, University of Nigeria, Nsukka, Nigeria

  • Department of Pharmaceutical Technology and Industrial Pharmacy, University of Nigeria, Nsukka, Nigeria

  • Department of Pharmaceutical Technology and Industrial Pharmacy, University of Nigeria, Nsukka, Nigeria

  • Abstract
  • Keywords
  • Document Sections

    1. 1. Introduction
    2. 2. Materials and Methods
    3. 3. Results and Discussion
    4. 4. Conclusion
    Show Full Outline
  • Abbreviations
  • Author Contributions
  • Conflicts of Interest
  • References
  • Cite This Article
  • Author Information