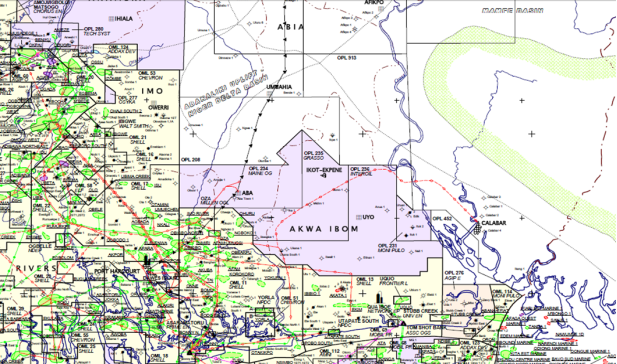
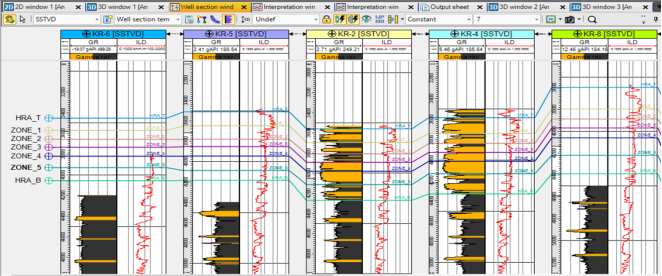
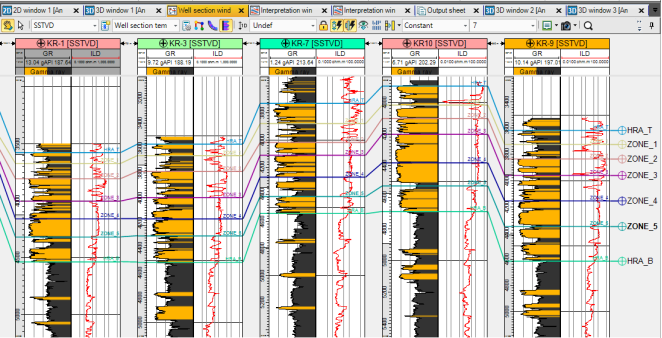
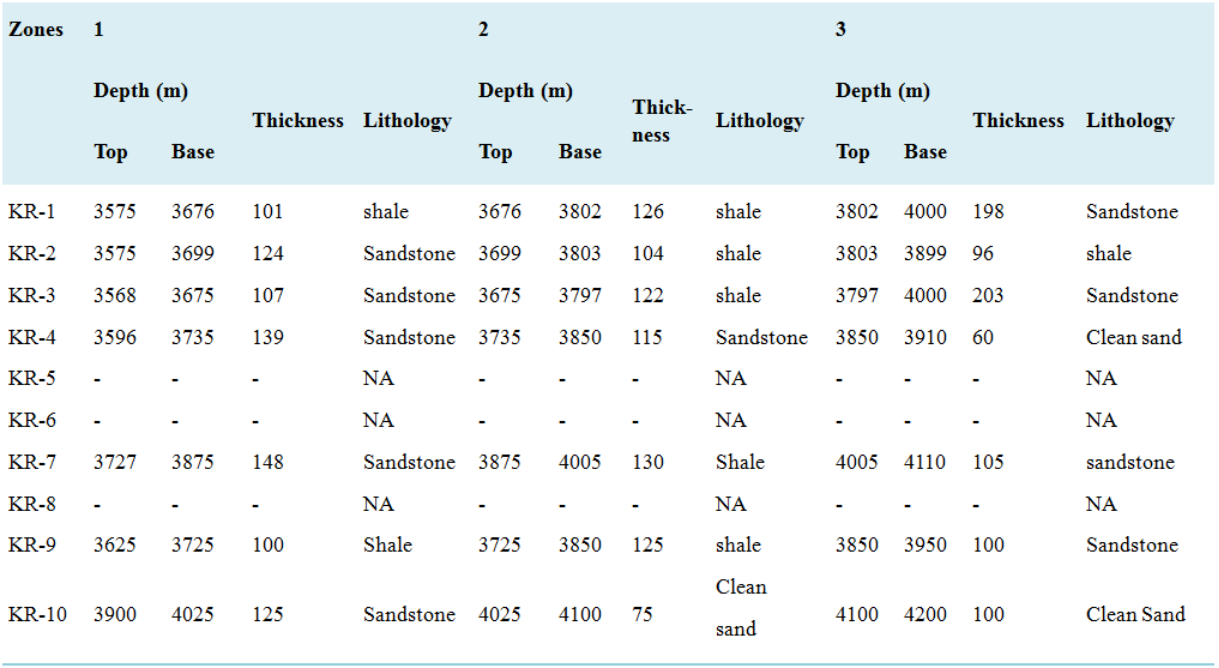
Characterization of reservoirs defines how well they can generate and store hydrocarbon, reservoir parameters are used to determine the behavior of reservoir fluids under various conditions and to identify the best production practices that can optimize hydrocarbon production, the objective is to identify and map reservoir sand zones using basic logs, provide information about the reservoir depth and thickness using well log data, interpret faults and sealing system using the seismic data and generate amplitude maps and model basic reservoir facies, the method applied was sectioned into three distinct parts that encompasses qualitative well log analysis, seismic interpretation and cross plotting of basic well logs versus amplitude for reservoir characterization, the well data analyzed shows well number 5, 6 and 8 have incomplete GR logs resulting in missing lithology while well 10 have some missing logs, such as, density (DEN) log, neutron porosity (NEU) log and porosity (POR) log, five logs needed for this study were available in the remaining complete wells. These logs include gamma ray (GR) log, resistivity (RES) log, density (DEN) log, neutron porosity (NEU) log, and porosity (POR) log. This study looks at a possible change in log signal due to an increase or decrease in seismic amplitude in characterizing a reservoir sand and how logs are influence with Amplitude peaks and trough.
| Published in | International Journal of Oil, Gas and Coal Engineering (Volume 12, Issue 2) |
| DOI | 10.11648/j.ogce.20241202.12 |
| Page(s) | 57-62 |
| Creative Commons |
This is an Open Access article, distributed under the terms of the Creative Commons Attribution 4.0 International License (http://creativecommons.org/licenses/by/4.0/), which permits unrestricted use, distribution and reproduction in any medium or format, provided the original work is properly cited. |
| Copyright |
Copyright © The Author(s), 2024. Published by Science Publishing Group |
Reservoir, Seismic Interpretation, Well Logs, Hydrocarbon
2.1. Aim and Objectives of the Study
2.2. Significance of the Study
4.1. Well Data
4.2. Petrophysical Evaluation
Zones | 4 | 5 | ||||||
|---|---|---|---|---|---|---|---|---|
Depth (m) | Thickness | Lithology | Depth (m) | Thickness | Lithology | |||
Top | Base | Top | Base | |||||
KR-1 | 4000 | 4151 | 151 | Sandstone | 4151 | 4325 | 174 | Clean sand |
KR-2 | 3899 | 3975 | 76 | Clean | 3975 | 4100 | 125 | Clean sand |
sand | ||||||||
KR-3 | 4000 | 4150 | 150 | Sandstone | 4150 | 4300 | 150 | Clean sand |
KR-4 | 3910 | 4010 | 100 | Clean | 4010 | 4125 | 115 | Sandstone |
sand | ||||||||
KR-5 | - | - | - | NA | - | - | - | NA |
KR-6 | - | - | - | NA | - | - | - | NA |
KR-7 | 4110 | 4290 | 180 | Sandstone | 4290 | 4410 | 120 | Sandstone |
KR-8 | - | - | - | NA | - | - | - | NA |
KR-9 | 3950 | 4175 | 225 | Sandstone | 4175 | 4362 | 187 | Sandstone |
KR-10 | 4200 | 4375 | 175 | Clean | 4375 | 4550 | 175 | Clean sand |
Sand | ||||||||
| [1] | Richardson, A. A. M. (2013). Well Correlation and Petrophysical Analysis, a Case Study of "Rickie" Field Onshore Niger Delta. The International Journal of Engineering And Science, 2319–1813. Retrieved from |
| [2] | Emujakporue, G. O., & Faluyi, T. O (2015). Evaluation of Hydrocarbon Volume in ‘TRH’ Field, Onshore Niger Delta, Nigeria. Intern. J. of Geophys. and Geochem. 2(5): 113-123. |
| [3] | Knut, B (2010). Petroleum Geoscience: From Sedimentary Environments to Rock Physics. Springer, New York. |
| [4] | Lyaka, A. L; Mulibo, G. D (2018). Petrophysical Analysis of the Mpapai Well Logs in the East Pande Exploration Block, Southern Coast of Tanzania: Geological Implication on the Hydrocarbon Potential. Open J. of Geol. 8: 781–802. |
| [5] | Obiora, D. N., Gbenga, D., & Ogobiri, G. (2016). Reservoir characterization and formation evaluation of a “Royal onshore field”, Southern Niger Delta using geophysical well log data. Journal of the Geological Society of India, 87(5), 591–600. |
| [6] | Okwoli, E; Obiora, D. N; Adewoye, O; Chukudebelu, J. U; & Ezema, P. O., (2015). Reservoir characteriztion and volumetric analysis of Lona Field, Niger Delta, using 3-D seismic data and well log data. Petroleum and Coal, 57(2): 108-119. |
| [7] | Hampson D. P, Russell B. (2012). HRS-9 software suite for reservoir characterization. Calgary, Canada. |
| [8] | Ahmad M. N, & Rowell P. (2012). Application of spectral decomposition and seismic attributes to understand the structure and distribution of sand reservoirs within tertiary rift basins of Gulf of Thailand. Lead Edge 31: 630–634. |
| [9] | Abdel-Fattah, M. and Tawfik A., (2015). 3D Geometric Modeling of the Abu Madi Reservoirs and Its Implication on the Gas Development in Baltim Area (Offshore Nile Delta, Egypt). Int. J. Geoph., 2015, 1-11. |
| [10] | Dembicki-Jr., H. (2017). Practical petroleum geochemistry for exploration and productions. Elsevier, 341pp. |
| [11] | Asadu, A. N., Omo-Irabor, O. O., and Ibe, K. A. (2015). Source Rock Characterisation of AGBADA Formation in Well Z, Offshore, Niger Delta, Nigeria. International journal for research in emerging science and technology. Vol. 2, 92-100. |
| [12] | Eteh D. R, Francis O., & Jonathan L. E., (2021). Site Suitability Study for Solid Waste Dumpsite Selection Using Geospatial-Based Multi-Criteria Analysis in Yenagoa, Bayelsa State Nigeria. Annals of Geographical Studies. Volume 4, Issue 1, PP 1-12 ISSN 2642-9136 |
| [13] | Adaeze, I. U., Samuel, O. O., & Chukwuma, J. I., (2012). Petrophysical evaluation of uzek well using well log and core data, Offshore Depobelt, Niger Delta, Nigeria. Advances in Applied Science Research, 2012, 3 (5): 2966-2991. |
| [14] | Ogbesejana, A. B., Bello, O. M., Uduma, A. U. (2018). Characterization of Source Rocks from Off-shore Niger Delta Basin. J. Appl. Sci. Environ. Manage. Vol. 22 (3), 356–361. |
| [15] | Najime T, Eduvie M. O & Jolly B., (2017). Evolution of the Niger Delta, present dynamics and the future. African Journals Online (AJOL). ISSN: 1118-1931. |
| [16] | Francis O. & Edeye E. (2020). AVO fluid inversion (AFI) technique as a tool to predict reservoir fluid content using data from FD field, Onshore Niger Delta Nigeria. IJCIRAS | ISSN (O) - 2581-5334. Vol. 3 Issue. 2. |
APA Style
Oborie, E., Adimie, E. O., Macdonald, I. (2024). Reservoir Characterization of KD Field Located Onshore of Akwa-Ibom State, Niger Delta, Nigeria Using Well Logs Property Comparison to Seismic Amplitude Analysis . International Journal of Oil, Gas and Coal Engineering, 12(2), 57-62. https://doi.org/10.11648/j.ogce.20241202.12
ACS Style
Oborie, E.; Adimie, E. O.; Macdonald, I. Reservoir Characterization of KD Field Located Onshore of Akwa-Ibom State, Niger Delta, Nigeria Using Well Logs Property Comparison to Seismic Amplitude Analysis . Int. J. Oil Gas Coal Eng. 2024, 12(2), 57-62. doi: 10.11648/j.ogce.20241202.12
AMA Style
Oborie E, Adimie EO, Macdonald I. Reservoir Characterization of KD Field Located Onshore of Akwa-Ibom State, Niger Delta, Nigeria Using Well Logs Property Comparison to Seismic Amplitude Analysis . Int J Oil Gas Coal Eng. 2024;12(2):57-62. doi: 10.11648/j.ogce.20241202.12
@article{10.11648/j.ogce.20241202.12,
  author = {Ebiegberi Oborie and Elvis Ogede Adimie and Indighe Macdonald},
  title = {Reservoir Characterization of KD Field Located Onshore of Akwa-Ibom State, Niger Delta, Nigeria Using Well Logs Property Comparison to Seismic Amplitude Analysis
},
  journal = {International Journal of Oil, Gas and Coal Engineering},
  volume = {12},
  number = {2},
  pages = {57-62},
  doi = {10.11648/j.ogce.20241202.12},
  url = {https://doi.org/10.11648/j.ogce.20241202.12},
  eprint = {https://article.sciencepublishinggroup.com/pdf/10.11648.j.ogce.20241202.12},
  abstract = {Characterization of reservoirs defines how well they can generate and store hydrocarbon, reservoir parameters are used to determine the behavior of reservoir fluids under various conditions and to identify the best production practices that can optimize hydrocarbon production, the objective is to identify and map reservoir sand zones using basic logs, provide information about the reservoir depth and thickness using well log data, interpret faults and sealing system using the seismic data and generate amplitude maps and model basic reservoir facies, the method applied was sectioned into three distinct parts that encompasses qualitative well log analysis, seismic interpretation and cross plotting of basic well logs versus amplitude for reservoir characterization, the well data analyzed shows well number 5, 6 and 8 have incomplete GR logs resulting in missing lithology while well 10 have some missing logs, such as, density (DEN) log, neutron porosity (NEU) log and porosity (POR) log, five logs needed for this study were available in the remaining complete wells. These logs include gamma ray (GR) log, resistivity (RES) log, density (DEN) log, neutron porosity (NEU) log, and porosity (POR) log. This study looks at a possible change in log signal due to an increase or decrease in seismic amplitude in characterizing a reservoir sand and how logs are influence with Amplitude peaks and trough.
},
 year = {2024}
}
TY  - JOUR
T1  - Reservoir Characterization of KD Field Located Onshore of Akwa-Ibom State, Niger Delta, Nigeria Using Well Logs Property Comparison to Seismic Amplitude Analysis

AU  - Ebiegberi Oborie
AU  - Elvis Ogede Adimie
AU  - Indighe Macdonald
Y1  - 2024/04/17
PY  - 2024
N1  - https://doi.org/10.11648/j.ogce.20241202.12
DO  - 10.11648/j.ogce.20241202.12
T2  - International Journal of Oil, Gas and Coal Engineering
JF  - International Journal of Oil, Gas and Coal Engineering
JO  - International Journal of Oil, Gas and Coal Engineering
SP  - 57
EP  - 62
PB  - Science Publishing Group
SN  - 2376-7677
UR  - https://doi.org/10.11648/j.ogce.20241202.12
AB  - Characterization of reservoirs defines how well they can generate and store hydrocarbon, reservoir parameters are used to determine the behavior of reservoir fluids under various conditions and to identify the best production practices that can optimize hydrocarbon production, the objective is to identify and map reservoir sand zones using basic logs, provide information about the reservoir depth and thickness using well log data, interpret faults and sealing system using the seismic data and generate amplitude maps and model basic reservoir facies, the method applied was sectioned into three distinct parts that encompasses qualitative well log analysis, seismic interpretation and cross plotting of basic well logs versus amplitude for reservoir characterization, the well data analyzed shows well number 5, 6 and 8 have incomplete GR logs resulting in missing lithology while well 10 have some missing logs, such as, density (DEN) log, neutron porosity (NEU) log and porosity (POR) log, five logs needed for this study were available in the remaining complete wells. These logs include gamma ray (GR) log, resistivity (RES) log, density (DEN) log, neutron porosity (NEU) log, and porosity (POR) log. This study looks at a possible change in log signal due to an increase or decrease in seismic amplitude in characterizing a reservoir sand and how logs are influence with Amplitude peaks and trough.

VL  - 12
IS  - 2
ER  -
Department of Geology, Niger Delta University, Amassoma, Nigeria
Department of Geology, Niger Delta University, Amassoma, Nigeria
Department of Petroleum Engineering, Afe Babalola University, Ado Ekiti, Nigeria
Information